Toll Brothers (TOL), a large home builder that is unique in that it specializes in luxury homes, has entered a bear market, off to $39.46 from a Jan. 22 high of $52. The drop from nearly $44 came on a measly 4 cent per share miss from expectations in its Q2 EPS. However, per ETrade, Q1 results, reported in February, beat expectations by much more, $0.21. Why the miss? The company's two main explanations were a $12 MM writedown of a struggling, older development in Connecticut, and slippage in closing 15 homes in California; these homes will close in the current, fiscal third quarter. Also, some condos in NYC had to be discounted, but apparently were still sold profitably; but this is a totally non-core part of TOL's business. Finally, some noted cancellations up a bit; but they are at a low level.
For all that, the analysts were almost ludicrous in their concern about SG&A above 10%. The company assured them that it will come down, but these things happen in luxury home building.
More important, the present looks bright based on the order book; TOL projects SG&A to decline despite increased expenses for 75 new selling communities planned to open by the end of October; and it reports it has not seen an adverse effect from rising rates.
So why were analysts so hesitant, to some extent even nervous Nellies, on the conference call, and why was the stock destroyed? And why did a stalwart such as D.R. Horton (DHI), and the most home builder-focused ETF (ITB), sell off in sympathy?
Some thoughts on these matters follow.
Home, sweet home; why are the builders not so sweet?Actually, some have been, including TOL, over the long haul.
Since going public in 1986, TOL has returned almost 13% per year, but with unpredictable choppiness:
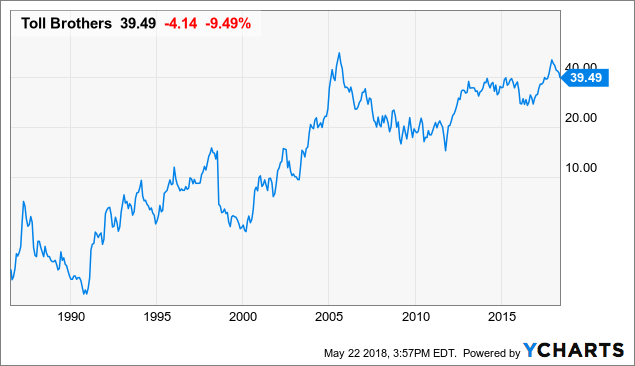 TOL data by YCharts
Looking at the data, it appears that the S&P 500 has returned about 7.7% per year since the same time in price, thus no more than 10% in total return counting dividends.
This is how my two favorite builders, TOL and DHI, have fared versus the ETF for the S&P 500 (SPY), since 1993:
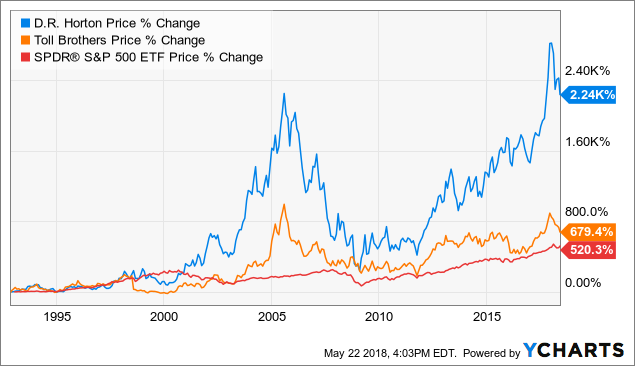 DHI data by YCharts
DHI has been great, but as discussed later, right now I find TOL more attractive.
The bursting of the housing bubble destroyed many weaker players. That both TOL and DHI have done well versus the SPY since the 2003-4 time frame may speak well to their resiliency. But psyches have been harmed, and no investor has to own these stocks. That's likely one reason why there is so little support for TOL, along with the predictable short selling.
The above are major reasons why I'm getting more interested in having more dollars exposed here, i.e. beginning to reverse the risk-off tactics I adopted in late January. The point of having a lot of cash on the sidelines is to deploy it.
The next section demonstrates my preferred way of thinking of TOL, DHI, home builders, and other value stocks in today's market. It's not the only relevant way to think about things, but it could explain a lot of how certain stocks trade these days.
The tech bubble-housing analogyThe Y2K period, really beginning in 1998, is important to my thesis, because something similar looks to be going on now.
The average stock peaked at the end of 1997, then had a very weak 1998. In contrast, the average tech/NASDAQ stock, and members of the SPY in general and favored non-tech large cap growth in particular, were strong. It was the bubble phenomenon, and by 2000, you can see how the red line (the SPY) moved far ahead of TOL and DHI. But, home sales did OK; so did prices. Yet Old Economy stocks, notably housing stocks in my observation, were depressed. By 1999 and 2000, I had a mantra about the alleged wisdom of the mythical Mr. Market. That mantra was, if "he" was really so filled with foreknowledge of the future, then the future of middle-class (and richer) Americans was to live in hovels surrounded by vast amounts of electronic gear. Tech was it!
But it soon wasn't. Soon, tech was a wreck. Hot one year, hated the next.
What was "it" in tech's place?
Yes - homes. Condos in sand states. Instead of double or triple ordering of semiconductor and other components for electronic gizmos, by 2005, there were the equivalent of double and triple ordering of ordinary homes/condos in ordinary (or less than ordinary) places.
The tech bubble was in essence repeated with the housing bubble.
Now fast forward to the Great Recession and its aftermath. Tech held up relatively well in the GR, but lingering worries about the economy and about tech made stalwarts such as Apple (AAPL) and Microsoft (MSFT) trade below 10X EPS in the 2010-2 period. But, look at them, and tech stocks (QQQ) now.
So: from the 1998-2000 peaking of the QQQ, it took over 10 years for tech to get hot again, more like 12-14 depending where you start from and when you think they did more than just rebound from the GR.
When did housing stocks peak? 2005.
We are now 13 years on. Just as MSFT and AAPL were silly cheap after the summer 2011 sell-off, and then again perhaps in 2012 (I haven't gone back to check the precise dates), many housing stocks are crazy cheap relative to the market (my tech bubble analogy again).
Now for some numbers to put meat on those bones.
Leading housing stocks versus the SPYSince you don't have to be Einstein to say that in investing, it's all relative, what matters most is the value of one asset versus another. Cash versus an equity versus a debt instrument, etc. In this case, let's say the SPY versus TOL. While TOL is not dirt cheap on objective standards, it's very cheap relative to the SPY.
Per the SPDRs web site, the SPY is shown at 21X TTM EPS. Whether that is adjusted numbers or GAAP, I'm not sure. TOL closed Tuesday at $39.46. Using ETrade data, I calculate TTM GAAP EPS of $3.69 for TOL. That's a 10.7X P/E.
The SPDR is at a forward P/E of about 17.4X. As of Wednesday, ETrade is showing FY consensus EPS for TOL of $4.46. The more precise comparator to 2018 earnings for the SPY would be projected EPS for TOL through the January 2019 quarter. This is lower, at $4.32. (Note, though, that FY 2019 consensus is higher than for 2018, at $4.86.)
At about 9X calendar 2018 EPS, TOL offers investors an approximate 11% earnings yield (reciprocal of the P/E). As discussed in the next section, this opens up potentially easy strategies to drive greater shareholder value even though the Street is not supporting TOL at this time.
The multiples for DHI, an easier company to analyze than TOL, are a little higher than for TOL, but in the same deep discount ballpark, and with steadier growth projected for DHI as well.
So, what justifies such deep discounts, now that you know that over the past 25-32 years, DHI and TOL have beaten the market?
Little but fear in my humble opinion.
And, there is a catalyst for TOL, a little-known one that might turn it into a durable and more consistent winner for a change.
The NVR exampleSorry for a third chart, but here's an exceptional stock chart of NVR (NVR), a large home builder, versus the outperformer DHI:
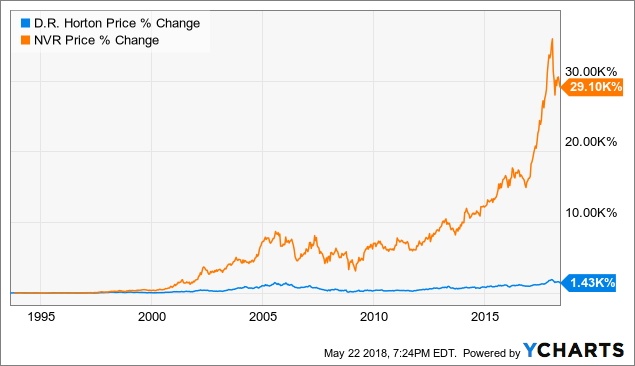 DHI data by YCharts
 Yes, it's real. The secret: great cash management, in two spheres.
NVR optioned rather than bought its land, thus saving its cash, and did little to no spec building. Then, when most of the time the stock was at a huge P/E discount to the market, it retired as many shares as it could. NVR's operations have been fine, but the stock has done what it has done from a massively cash-efficient operational and financial engineering strategy. And the result is that NVR now trades at 19X TTM EPS and at around a $3000 share price, about 13.3X projected 2019 EPS of $225 per share. But projected sales growth is lower than projected for both TOL and DHI through 2019. Some of the premium P/E probably relates to NVR's financial strength, but I don't see all that much difference, so I think a lot of the valuation premium comes from its established record of growth. (Yet a premium P/E makes the benefit of buybacks to NVR less compelling now, especially compared to TOL's opportunity.)
TOL is going toward the NVR model: optioning more land, finding ways to put up less cash on some of its deals, and doing substantial buybacks. So: quality of cash utilization over quantity. If successful, this could finally lead to TOL's stock outperforming the business, as has occurred for NVR.
That it is doing well operationally led to the CFO sounding frustrated and emphatic about TOL's progress on the conference call (just my opinion).
This is why I like TOL more than DHI now, though I bought some DHI as well as more TOL on the crash Tuesday. If TOL is trading at 8-9X 2018-9 earnings (no guarantees), there could be a small pot of gold to investors now that the stock price has dropped so much.
As noted, no one has to own a housing stock, which is a cyclical beast that has no glamour and little support on the Street. Fed tightening and recession can do a company great harm, and this can be the case even for leaders such as TOL and DHI.
Concluding comments - TOL for the long runIn the Trump era, I believe I first mentioned TOL on November 25, 2016, in Markets Think 'MAGA' - So, Buying Builders; Focus On Toll Brothers. The stock was $30 then, so it has had a little more than a 30% total return in 1 1/2 years, still fine, and the stock is now quite cheap to the SPY. I am not foreseeing a 2019-20 recession that the Street to a significant degree does expect, so that's one reason for yours truly to hang tough with a cyclical stock. Another reason is that going back to the 1999-2000 period where we had Cisco (CSCO) and Yahoo! (now Altaba (AABA)) instead of Amazon (AMZN), Netflix (NFLX) and Tesla (TSLA) today, TOL and other home builders can move up in a recessionary bear market period:
TOL bottomed in February 2000 at a split-adjusted $4 per share. By the time the SPY bottomed in or around October 2002, TOL was at $9.
Something similar could happen again.
As you can see, this article is focused on TOL's stock, and is not a review of the quarter, which you are welcome to explore for yourself. TOL has diversified its business lines, and is geographically diverse as well. If you are interested in TOL but are unfamiliar with it, some investment of time will be required to understand its story in detail. (DHI is simpler; so is NVR.)
I am long TOL and DHI somewhat for trading gains but more for a reversion upward toward the mean for home building as a percentage of GDP in the United States, and very possibly eventually, as with tech now, to a level above the mean. Thus my major goal with these stocks is long term capital appreciation, understanding that the risks are not trivial and patience likely will be required.
Thanks for reading and sharing any comments you wish to contribute.
Disclosure: I am/we are long TOL,DHI,AAPL,MSFT.
I wrote this article myself, and it expresses my own opinions. I am not receiving compensation for it (other than from Seeking Alpha). I have no business relationship with any company whose stock is mentioned in this article.
Additional disclosure: Not investment advice. I am not an investment adviser.
No comments:
Post a Comment