With all eyes on the stock market as major indexes flirt with all-time highs, Guggenheim is circumventing the euphoria surrounding equities by expanding its lineup of corporate bond ETFs. The Chicagoland-based ETF issuer is adding two new fixed income funds aimed at investors in search of more targeted maturities when it comes to corporate bonds exposure .
This bond ETF launch comes at an opportune time for bargain shoppers seeing as how fixed income securities across the board have endured a rough stretch of profit taking as a result of all the Fed-stimulus fears, which have already faded away for the most part.
Bond Bulls Eyeing New BulletShares ETFsThe new funds which hit the street today are the:
BulletShares 2021 Corporate Bond ETF
BulletShares 2022 Corporate Bond ETF Unlike most fixed income ETFs on the market today, the BulletShares product suite invests in debt securities scheduled to mature in a specific, single calendar year. As that year arrives and the debt begins to mature, proceeds are not reinvested but rather distributed to investors. For this reason, BulletShares ETFs have gained tremendous popularity since launching in 2010 as they more closely replicate the experience of investing in individual bonds while still providing immediate diversification across a basket of securities .
Similar to all of the existing corporate bond BulletShares ETFs, BSCL and BSCM will each charge 0.24% in expense fees.
Currently, the two most popular corporate bonds BulletShares ETFs by AUM targeting corporate bonds are the:
2015 Corporate Bond Fund 2014 Corporate Bond Fund The "junk bond" flavor of BulletShares has been even more successful, as these two High-Yield Bond ETFs dominate their investment grade-counterparts when it comes to total assets under management:
2015 High Yield Corporate Bond Fund 2014 High Yield Corporate Bond Fund Meet The Corporate Bond Fund CompetitionThe new BulletShares funds will join a fairly crowded space, ! comprised of over three dozen offerings with an average expense ratio of 0.22%. Although BulletShares separate themselves from the pack quite nicely by offering exposure that more closely resembles the purchase of an actual bond, BSCL and BSCM will still face stiff competition from more established funds; the Corporate Bonds ETFdb Category is dominated by:
iShares Investment Grade Corproate Bond Fund with $19 billions in AUM
iShares Barclays 1-3 Year Credit Bond Fund with nearly $11 billion in AUMVanguard Short-Term Corporate Bond ETF with over $6 billion in AUMThe new BulletShares products will likely taken on appeal among investors with more specific risk tolerance and current-income goals in mind given their unique, single-year maturity structure.
Follow me on Twitter @SBojinov
Disclosure: No positions at time of writing.
Thursday, October 31, 2013
US Stock Futures Down Ahead Of Jobless Claims Data

Pre-open movers
US stock futures fell in early pre-market trade, ahead of jobless claims report. Data on weekly jobless claims will be released at 8:30 a.m. ET, while the Chicago PMI for October will be released at 9:45 a.m. ET. Futures for the Dow Jones Industrial Average tumbled 26 points to 15,527.00, while the Standard & Poor's 500 index futures declined 2.60 points to 1,755.90. Futures for the Nasdaq 100 index dropped 15.25 points to 3,377.00.
A Peek Into Global Markets
European markets were mixed today, with the Spanish Ibex Index gaining 0.66%, London's FTSE 100 index dropping 0.44% and STOXX Europe 600 Index climbing 0.11%. German DAX 30 index fell 0.17% and French CAC 40 Index climbed 0.11%.
Asian markets ended mostly lower today. Japan's Nikkei Stock Average fell 1.20%, China's Shanghai Composite declined 0.87% and Hong Kong's Hang Seng Index tumbled 0.42%. Australia's ASX/S&P500 fell 0.09% and India's Sensex jumped 0.62%.
Broker Recommendation
Analysts at Bank of America upgraded Expedia (NASDAQ: EXPE) from "neutral" to "buy." The target price for Expedia has been raised from $60 to $75.
Expedia's shares jumped 18.80% to $59.35 in pre-market trading.
Breaking news
Time Warner Cable (NYSE: TWC) reported a drop in its third-quarter profit. Time Warner Cable's quarterly profit fell to $532 million, or $1.84 per share, from $808 million, or $2.60 per share, in the year-ago period. To read the full news, click here. Synergy Pharmaceuticals (NASDAQ: SGYP) today announced the start of a phase 2 clinical trial to evaluate the safety and efficacy of SP-333, its second-generation GC-C agonist and once-daily oral treatment, in adult patients with opioid-induced constipation (OIC). To read the full news, click here. Cigna (NYSE: CI) reported a 19% rise in its third-quarter earnings and lifted its full-year earnings outlook. To read the full news, click here. Charm Communications (NASDAQ: CHRM) announced today that the special committee of the Company's board of directors, consisting of independent directors Mr. Zhan Wang, Mr. Andrew J. Rickards and Mr. Gang Chen, has retained China Renaissance Securities (Hong Kong) Limited as its financial advisor and Gunderson Dettmer Stough Villeneuve Franklin & Hachigian, LLP as its legal advisor. To read the full news, click here.Posted-In: Bank of America US Stock FuturesNews Eurozone Futures Global Pre-Market Outlook Markets
(c) 2013 Benzinga.com. Benzinga does not provide investment advice. All rights reserved.
Around the Web, We're Loving... Learn to Use Trading Platforms Like Hedge Fund Traders do Rumsfeld: Denial of Benefits to Fallen Soldiers' Families 'Inexcusable' Come See How the Pro's Trade in this Exclusive Webinar Facebook, Baidu Lead Big Caps Beating Shutdown What Should You Know About AMZN? Most Popular IBM Authorizes $0.95 Dividend; Authorizes $15B In Additional Buybacks What is Apple's Tim Cook Hinting at for 2014? Facebook Shares Edge Higher After Hours Following Upgrade to Buy from BTIG's Greenfield Is a Beer Mega-Merger On Tap? Earnings Scheduled For October 30, 2013 Net Optics Announces Pending Acquisition by Ixia for $190M in Cash Related Articles (CI + CHRM) US Stock Futures Down Ahead Of Jobless Claims Data UPDATE: Cigna Posts Higher Q3 Profit, Lifts Full-Year Forecast Charm Communications Special Committee Names Advisers to Evaluate 'Going Private' Proposal Earnings Scheduled For October 31, 2013 UPDATE: Susquehanna Raises PT on CIGNA Corporation Ahead of 3Q Results Report Benzinga's Weekend M&A Chatter View the discussion thread. Partner Network #marketfy-ae-block { display: none; border: 2px solid #0a3f75; overflow: hidden; width: 300px; height: 125px; text-align: center; background-color: #45719E; position: relative; z-index: 1; } #marketfy-ae-block a { display: block; width: 300px; height: 125px; position: relative; z-index: 2; color: #ffffff; text-decoration: none; } #marketfy-ae-block-countdown-text { color: #f9fc99; padding: 0px 0 0 0; font-size: 19px; font-weight: bold; line-height: 19px; } #marketfy-ae-block-countdown-text-start { font-size: 12px; } #marketfy-ae-block-countdown { padding: 5px 0 5px 0; font-size: 26px; } #marketfy-ae-block-signup { padding: 5px 47px; } #marketfy-ae-block-signup:hover { background-color: #457a1a;Tuesday, October 29, 2013
Will An Acquisition Help Nokia?
With shares of Nokia (NYSE:NOK) trading around $3, is NOK an OUTPERFORM, WAIT AND SEE or STAY AWAY? Let's analyze the stock with the relevant sections of our CHEAT SHEET investing framework:
T = Trends for a Stock’s MovementNokia operates as a mobile communications company worldwide. It designs and develops mobile products and services; provides digital map information and related location-based content and services for mobile navigation devices, automotive navigation systems, Internet-based mapping applications; and provides mobile and fixed network infrastructure, communications and networks service platforms, as well as professional services and business solutions, to operators and service providers. Nokia operates in three segments: Devices & Services, HERE, and Nokia Siemens Networks.
Nokia has announced it will acquire the remaining stake it doesn't already own in the Nokia Siemens network. Nokia is buying Siemens's (NYSE:SI) 50 percent of the network for a lower-than-expected 1.7 billion euros. Shares in both companies rose after the announcement. The mobile movement is very hot at the moment and if executed correctly, Nokia may be able to see significant profits. Should Nokia provide more relevant mobile products, look for it to become a major player in the space once again.
T = Technicals on the Stock Chart are MixedNokia stock seen a reasonable amount of selling pressure in recent years. The stock is now rebounding higher on higher highs and higher lows. Analyzing the price trend and its strength can be done using key simple moving averages. What are the key moving averages? The 50-day (pink), 100-day (blue), and 200-day (yellow) simple moving averages. As seen in the daily price chart below, Nokia is trading above its rising key averages which signal neutral to bullish price action in the near-term.

(Source: Thinkorswim)
Taking a look at the implied volatility (red) and implied volatility skew levels of Nokia options may help determine if investors are bullish, neutral, or bearish.
| Implied Volatility (IV) | 30-Day IV Percentile | 90-Day IV Percentile | |
| Nokia Options | 66.11% | 70% | 68% |
What does this mean? This means that investors or traders are buying a significant amount of call and put options contracts, as compared to the last 30 and 90 trading days.
| Put IV Skew | Call IV Skew | |
| July Options | Flat | Average |
| August Options | Flat | Average |
As of today, there is an average demand from call buyers or sellers and low demand by put buyers or high demand by put sellers, all neutral to bullish over the next two months. To summarize, investors are buying a significant amount of call and put option contracts and are leaning neutral to bullish over the next two months.
On the next page, let’s take a look at the earnings and revenue growth rates and the conclusion.
E = Earnings Are Decreasing Quarter-Over-QuarterRising stock prices are often strongly correlated with rising earnings and revenue growth rates. Also, the last four quarterly earnings announcement reactions help gauge investor sentiment on Nokia’s stock. What do the last four quarterly earnings and revenue growth (Y-O-Y) figures for Nokia look like and more importantly, how did the markets like these numbers?
| 2013 Q1 | 2012 Q4 | 2012 Q3 | 2012 Q2 | |
| Earnings Growth (Y-O-Y) | 13.64% | -87.10% | -778.57% | -537.50% |
| Revenue Growth (Y-O-Y) | -23.40% | -20.68% | -23.13% | -29.56% |
| Earnings Reaction | -12.93% | -8.92% | -5.00% | 6.49% |
Nokia has seen mostly decreasing earnings and revenue figures over the last four quarters. From these numbers, the markets have been disappointed with Nokia’s recent earnings announcements.
P = Average Relative Performance Versus Peers and SectorHow has Nokia stock done relative to its peers, Apple (NASDAQ:AAPL), BlackBerry (NASDAQ:BBRY), Ericsson (NASDAQ:ERIC), and sector?
| Nokia | Apple | BlackBerry | Ericsson | Sector | |
| Year-to-Date Return | -2.15% | -23.24% | -12.97% | 13.42% | 2.64% |
Nokia has been an average performer, year-to-date.
ConclusionNokia provides valuable communications products to consumers and companies worldwide. With the recent acquisition of the remaining stake of the Nokia Siemens Network, the company is poised to continue to grow. The stock has struggled in recent years but is now seeing a powerful rebound. Over the last four quarters, investors in the company have been disappointed as earnings and revenue figures have been mostly decreasing. Relative to its weak peers and sector, Nokia has been an average year-to-date performer. WAIT AND SEE what Nokia does this coming quarter.
GBR: High-Flying Stock of the Day
CHARLOTTE, N.C. (Stockpickr) -- Dallas-based New Concept Energy (GBR), formerly known as CabelTel International, is primarily an operator of oil and gas wells, in the U.S. and also owns mineral leases in Ohio and West Virginia. Interestingly, it also leases and operates Pacific Pointe Retirement Inn, a retirement community located in King City, Ore.
At the time of this writing, GBR is up 54% today, trading at $2.22, after trading earlier as high as $2.58.
Fundamentally, the stock indicates at this price level a trailing price-to-earnings ratio of only 2.5. However, a cursory glance reveals no forward guidance provided by the company, so there is no forward P/E figure. Book value per share shows as $3.50.
A glance at the monthly chart shows this stock has undergone several huge and very brief price spikes, historically, with concurrent huge volume spikes, relative to GBR's typically very low volume.
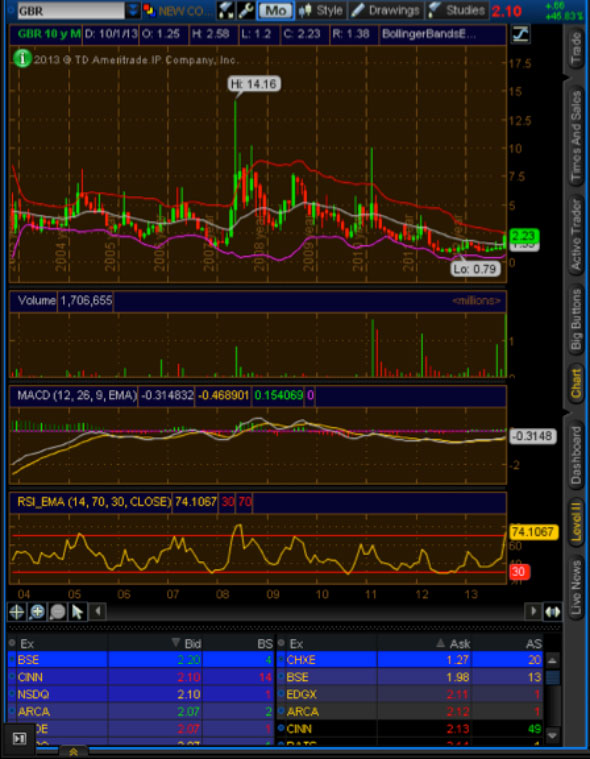
Based solely upon the previous similar occurrences, this current price spike could see significant upside from the current level.
Let the buyer beware, though. As can be seen in the monthly chart, each of these price and volume spikes has been immediately followed by a return to much lower price and volume levels, so I imagine that a number of traders/investors have found themselves trapped in their positions.
So if you decide to try to play this price and volume spike, be nimble.
-- Written by Ben Brinneman in Charlotte, N.C.
Trader Ben Brinneman, featured on MarketWatch, Bloomberg and Reuters, resides in Charlotte, N.C., and is the owner of C Squared Trading. Brinneman started his career trading bonds for U.S. Bancorp and was an analyst for a wealth management firm. Brinneman and his team at C Squared Trading have taught hundreds in a one-on-one mentorship setting via Skype or live in Charlotte.
You can follow some of their free trades and tips on Twitter at @csquaredtrading.
Monday, October 28, 2013
Are These Recent IPOs Still Winners?
The IPO market is looking forward to November 15, 2013. Twitter (TWTR) will no doubt be a hot stock and should also provide the mass media with lots to talk about. The NYSE even performed a test over the weekend to see if it could handle the expected intense volume.
Twitter is one thing... but the health of the IPO market is another. So how has that market been? What are the top performers? Let's take a look.
IPOs This Year
A simple Google search for IPO stories in the media will result in several links to stories of stocks that have doubled on their first day of offering. To avoid duplication of efforts, here are those names that have more than doubled in their first day of trading.
BenefitFocus (BNFT)
Noodles and Co. (NDLS)
Potbelly (PBPB)
Sprouts Farmers Market (SFM)
The stocks listed above all had a huge pop on the first day and three are currently Zacks Rank #3 (Hold) rated stocks. PBPB is not yet ranked as analyst reports have not yet come out. Having a rank of #3 (Hold) soon after an IPO is pretty common as underwriting banks have to wait a period of time before they can initiate coverage. The Zacks Rank tends to move up when there is a positive revision to estimates and that could take some time.
It is clear that if we have four stocks that have doubled on the first day of trading, the market is pretty strong.
Recent IPO's With High Zacks Rank
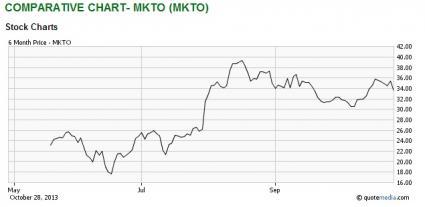
Marketo (MKTO) is a Zacks Rank #2 (Buy) and has been public since late May. That time horizon has allowed analysts a few chances to increase their estimates.
The internet marketing company has had two earnings reports since going public. The first was on July 30 and the company missed that quarter with a wider loss than expected. This has been fairly common on new companies as they have not been able to get the full story to analysts or there is some noise in the first reporting quarter.
Investors easily forgave the company for the 12.7% negative earnings surprise and bid the s! tock higher by 21.5% in the session following its first report.
The next report was much better. A two cent beat of a 6.9% positive earnings surprise helped the stock move higher in the session following the report.
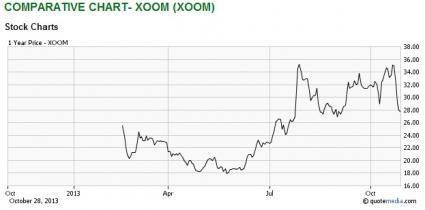
Xoom (XOOM) is also a Zacks Rank #2 (Buy) stock that IPO'ed this year. The stock zoomed higher by a healthy 60% on its first day of trading. The online international money transfer service has been public since February 15 and had an offering price of $16 per share.
Since that time, estimates have soared. When the first research reports were out in March, the Zacks Consensus Estimate for 2013 was calling for a loss of $0.24 per share. By July, the estimate had turned the corner to a gain of $0.01 and following a recent report, the consensus is now looking at $0.11.
A very similar trend exists for 2014, with estimates moving from a loss of $0.06 to a gain of $0.08 over the same time horizon, above for the first two estimates. The 2014 Zacks Consensus is now calling for a gain of $0.18 and that translates to an implied earnings growth rate of 63%.
As Twitter comes to the market there should be a lot of fanfare. This will be the hottest issue of the year and will continuously be compared to Facebook (FB) and its IPO.
Needless to say, the FB IPO was a disaster and caused a great many retail investors to take substantial losses. Over time, the stock recovered and is now well above the IPO price and first trade.
It might be of interest to learn that Facebook is a Zacks Rank #2 (Buy). TheFace! book as i! t used to be called (at least that is what I learned from the movie "The Social Network") has seen 2 straight positive earnings surprises.
The most recent one came on July 24th and it propelled the stock higher by 31% after investors saw a 44% positive earnings surprise. They also saw a glimpse of how the company plans to monetize the $1B+ investment in Instagram as well.
Buy what will Twitter's Rank Be? As we have seen from other IPOs, it will take some time to get research reports from covering analysts in. Then it will take some more time before they have an opportunity to increase estimates ... so don't be surprised if the company has no Zacks Rank its first day of trading, or even no Rank a month or more after its public debut.
FACEBOOK INC-A (FB): Free Stock Analysis Report
MERKETO INC (MKTO): Free Stock Analysis Report
POTBELLY CORP (PBPB): Get Free Report
SPROUTS FMR MKT (SFM): Free Stock Analysis Report
XOOM CORP (XOOM): Free Stock Analysis Report
Source: Are These Recent IPOs Still Winners?Safety in Numbers With This Pipeline Play

Source: Wikimedia Commons.
They say two (or more) is better than one, and that seems to be the case for these companies that are working together to accomplish a common goal.
A foursome
Enterprise Products Partners (NYSE: EPD ) , Anadarko Petroleum (NYSE: APC ) , and DCP Midstream, a joint venture between Spectra Energy (NYSE: SE ) and Phillips 66 (NYSE: PSX ) , are about to complete the Front Range pipeline, which will run from the DJ Basin down to the Texas Express pipeline. It will be able to carry 150,000 bpd of natural gas liquid (NGL) with the possibility to increase that to 230,000 bpd if production keeps increasing. Front Range is expected to come online in the forth quarter of 2013.
This pipeline venture is a great idea for several reasons. Anadarko needs to get its NGL to a buyer, so it needs to be able to ship its NGL to refineries on the coast. Enterprise Products Partners is seeking growth by building new pipelines, so it's happy to invest with an E&P player to help Anadarko out and profit at the same time. For DCP, Spectra needs NGL to move/store and Phillips 66 needs NGL to process into a final project.
All four players benefit from this project and stand to profit from the creation of the pipeline. There is no reason why it always has to be a dog-eat-dog world; companies are fully capable of working together to achieve a mutually beneficial goal.
Add in one more
The purpose of the Front Range pipeline is to connect the DJ Basin to Texas, but it only goes part of the way. To get the NGL all the way there, Enterprise Products Partners, Anadarko, Phillips 66, Spectra (through DCP), and Enbridge Energy Partners (NYSE: EEP ) are working together to build the Texas Express pipeline.
Texas Express will carry NGL all the way down to Texas to be processed and is expected to come online in the forth quarter of 2013, in conjunction with the Front Range pipeline. The Texas Express will have the capacity to move 280,000 bpd of NGL, with the possibility to increase that to 400,000 bpd as market conditions dictate.
All five of these players want the same thing, to get NGL to Texas. They all stand to see significant increases in their cash flow as a result. Whether it's the fees to move the NGL, the ability to sell NGL for the highest price possible, or having more NGL to process into a final product, all of these companies rely on each other.
Going solo
Enterprise Products Partners is also building out pipeline capacity by itself. Rising production from the Rocky Mountain region means more pipeline capacity needs to be brought online to move the additional output.
Enterprise Products Partners is going to increase the capacity of its NGL Mid-America Pipeline from 275,000 bpd to approximately 350,000 bpd, and the increased capacity will come online in the second quarter of 2014. The pipeline transports NGL down to Texas to be refined. The additional capacity will enable Enterprise Products Partners to capitalize on multiple NGL plays and will increase its cash flow as well. That will allow it to continue to increase its capacity around America and boost its 7% distribution.
Final thoughts
America is a great country, built on the back of competition. Sometimes, though, companies can work together to boost their bottom lines and increase cash flows. This is the case for these energy companies, and the several joint ventures that they are invested in will increase value for shareholders.
More ways to profit from America's energy boom
Record oil and natural gas production is revolutionizing the United States' energy position. Finding the right plays while historic amounts of capital expenditures are flooding the industry will pad your investment nest egg. For this reason, the Motley Fool is offering a comprehensive look at three energy companies set to soar during this transformation in the energy industry. To find out which three companies are spreading their wings, check out the special free report, "3 Stocks for the American Energy Bonanza." Don't miss out on this timely opportunity; click here to access your report -- it's absolutely free.
NOV Stomps on Estimates
As odd as it is to see an article pertaining to quarterly earnings on our site, I just couldn't resist. National Oilwell Varco (NOV) has officially put up some pretty impressive numbers. On Oct. 25, 2013, the company reported that for the third quarter ending on Sept. 30, 2013, it earned a net income of $636 million ($1.49 per share). If we compare this to last quarter, which earned a net income of $531 million, we can see that in just one quarter NOV experienced almost a 20% increase in revenue. Even if we take away the $10 million in pre-tax transaction charges and the $102 million in pre-tax gains that are results from the settlement of an outstanding legal claim, net income has still increased almost 8%. Part of this is due to operating profit increasing 3% (to 15% of sales) for the quarter.

From a long term investor's standpoint, that's not the most impressive statistic that I took from the recent release. Most impressive to me is NOV's constantly increasing backlog. As of Sept. 30, 2013, the company's Rig Technology segment reached a record backlog level of $15.15 billion. This is a super impressive increase of 9% since the end of the second quarter of 2013, and a 30% increase from the same time last year (September 30, 2012). The company had $3.31 billion worth of new orders for the quarter, which represents over 21% of their backlog. This is mathematical proof of the strong demand for oilfield equipment.
Here's what Pete Miller, chairman and CEO of National Oilwell Varco, had to say about the company's most recent achievements:
"Outstanding execution enabled the Company to achieve solid results again this quarter. All three segments posted higher sequential revenues and margins, and collectively reduced the Company's working capital requirements, which ultimately led to a quarterly record of $1 billion in cash flow from operations. We also added! significant new bookings to our capital equipment backlog for the Rig Technology segment during the third quarter, as the industry's demand for our suite of technologies remains strong.
We are excited about our recently announced plans to spin-off the Company's distribution business from the remainder of the Company, creating two stand-alone, publicly traded corporations. We believe that the contemplated spin-off is very consistent with NOV's strategy and commitment to continue to grow the Company and create significant shareholder value. As separate companies, the distribution business and the remainder of NOV will each be better positioned and have the enhanced operational flexibility to focus on their specific products, services and customers."
Here is the recent quarterly comparison of consolidated statements of income.
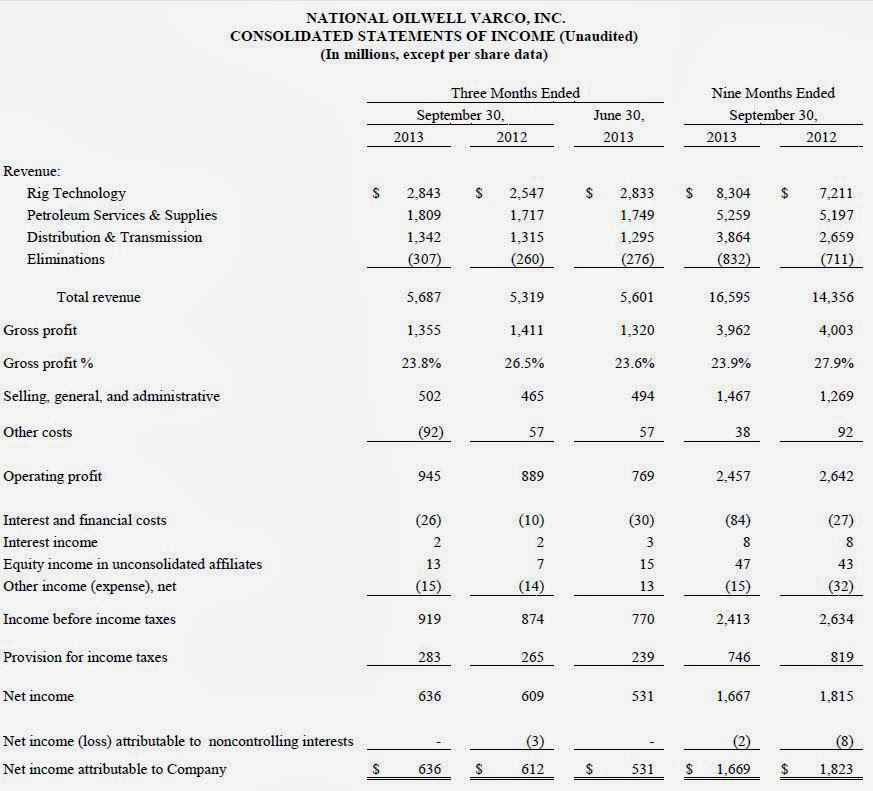 [ Enlarge Image ]
The share price for NOV has increased 13% since my previous, and very brief, article about the company was written on Aug. 27, 2013. I believe that with the increasing demand for NOV's services, as well as the impressive management, the company is poised for more. What are your thoughts? What do these impressive results mean to you?
End Notes
Disclosure: Currently long NOV.
Disclaimer: The opinions and ideas in this article are for informational and educational purposes only. They are not a recommendation to buy or sell any stock at any given time. As always, it is imperative for each individual investor to do their own due diligence and perform their own research on any and all stocks before making an investment decision.
Sunday, October 27, 2013
Why WGL Holdings's Earnings May Not Be So Hot
Although business headlines still tout earnings numbers, many investors have moved past net earnings as a measure of a company's economic output. That's because earnings are very often less trustworthy than cash flow, since earnings are more open to manipulation based on dubious judgment calls.
Earnings' unreliability is one of the reasons Foolish investors often flip straight past the income statement to check the cash flow statement. In general, by taking a close look at the cash moving in and out of the business, you can better understand whether the last batch of earnings brought money into the company, or merely disguised a cash gusher with a pretty headline.
Calling all cash flows
When you are trying to buy the market's best stocks, it's worth checking up on your companies' free cash flow once a quarter or so, to see whether it bears any relationship to the net income in the headlines. That's what we do with this series. Today, we're checking in on WGL Holdings (NYSE: WGL ) , whose recent revenue and earnings are plotted below.

Source: S&P Capital IQ. Data is current as of last fully reported fiscal quarter. Dollar values in millions. FCF = free cash flow. FY = fiscal year. TTM = trailing 12 months.
Over the past 12 months, WGL Holdings burned $13.8 million cash while it booked net income of $157.1 million. That means it burned through all its revenue and more. That doesn't sound so great. FCF is less than net income. Ideally, we'd like to see the opposite.
All cash is not equal
Unfortunately, the cash flow statement isn't immune from nonsense, either. That's why it pays to take a close look at the components of cash flow from operations, to make sure that the cash flows are of high quality. What does that mean? To me, it means they need to be real and replicable in the upcoming quarters, rather than being offset by continual cash outflows that don't appear on the income statement (such as major capital expenditures).
For instance, cash flow based on cash net income and adjustments for non-cash income-statement expenses (like depreciation) is generally favorable. An increase in cash flow based on stiffing your suppliers (by increasing accounts payable for the short term) or shortchanging Uncle Sam on taxes will come back to bite investors later. The same goes for decreasing accounts receivable; this is good to see, but it's ordinary in recessionary times, and you can only increase collections so much. Finally, adding stock-based compensation expense back to cash flows is questionable when a company hands out a lot of equity to employees and uses cash in later periods to buy back those shares.
So how does the cash flow at WGL Holdings look? Take a peek at the chart below, which flags questionable cash flow sources with a red bar.

Source: S&P Capital IQ. Data is current as of last fully reported fiscal quarter. Dollar values in millions. TTM = trailing 12 months.
When I say "questionable cash flow sources," I mean items such as changes in taxes payable, tax benefits from stock options, and asset sales, among others. That's not to say that companies booking these as sources of cash flow are weak, or are engaging in any sort of wrongdoing, or that everything that comes up questionable in my graph is automatically bad news. But whenever a company is getting more than, say, 10% of its cash from operations from these dubious sources, investors ought to make sure to refer to the filings and dig in.
With 27.8% of operating cash flow coming from questionable sources, WGL Holdings investors should take a closer look at the underlying numbers. Within the questionable cash flow figure plotted in the TTM period above, other operating activities (which can include deferred income taxes, pension charges, and other one-off items) provided the biggest boost, at 19.4% of cash flow from operations. Overall, the biggest drag on FCF came from capital expenditures.
A Foolish final thought
Most investors don't keep tabs on their companies' cash flow. I think that's a mistake. If you take the time to read past the headlines and crack a filing now and then, you're in a much better position to spot potential trouble early. Better yet, you'll improve your odds of finding the underappreciated home-run stocks that provide the market's best returns.
Can your retirement portfolio provide you with enough income to last? You'll need more than WGL Holdings. Learn about crafting a smarter retirement plan in "The Shocking Can't-Miss Truth About Your Retirement." Click here for instant access to this free report.
We can help you keep tabs on your companies with My Watchlist, our free, personalized stock tracking service.
Add WGL Holdings to My Watchlist.Saturday, October 26, 2013
Ford’s Mulally dispels Microsoft CEO rumors
ATHENS, Ga. – Despite resurfaced rumors that he is on the very short list to replace outgoing CEO Steve Ballmer at Microsoft, Ford CEO Alan Mulally maintains that that is not in his plans.
"I love serving Ford and have nothing new to add to (my) plans to continue serving Ford," he said in an exclusive interview with USA TODAY.
Mulally was at the University of Georgia Tuesday to participate in the 16th USA TODAY CEO Forum.
Over the last several weeks, media reports have mentioned Mulally as the leading candidate to succeed Ballmer as the software giant's CEO.
Mulally is known for his ability to turnaround troubled companies. Before coming to Ford in 2006, Mulally spent 37 years at Boeing where he helped outflank competitor Airbus with the Boeing 777 jetliner. At Ford, he ushered in transparency and transformed the car maker into a leaner company.
Even though Ford had a record loss in 2008, the company avoided government bailout loans given to GM and Chrysler. The company reported a profit the next year and has had 16 consecutive profitable quarters. On Tuesday, Ford also announced that the company's September sales were the best since 2006.
Mulally has said he will stay at Ford through 2014, but the board of directors has indicated it would not stand in his way if he chooses to leave earlier.
With Microsoft, Ford co-developed the Sync infotainment system that lets drivers connect their smartphones in Ford vehicles. Mulally called Microsoft "a great company" and "a great partner."
He downplayed rumors early last month and Mulally's heir apparent, current chief operating officer Mark Fields dismissed reports that resurfaced last week.
But the public speculation helps confirm Ford's ascendance as a technology company, Mulally admits. "Clearly, we have been leading this and it's very important to consumers," he said. "We just love the response they have to our vehicles."
Why Leap Wireless Shares Leapt Higher
Although we don't believe in timing the market or panicking over market movements, we do like to keep an eye on big changes -- just in case they're material to our investing thesis.
What: Shares of Leap Wireless (NASDAQ: LEAP ) have leapt higher today by more than double, up by 116% at the high, following news that AT&T (NYSE: T ) has agreed to acquire the pre-paid carrier.
So what: Ma Bell has offered $15 per share in cash, valuing Leap at $1.2 billion. In addition, Leap shareholders will receive the net proceeds from the sale of spectrum in Chicago, which Leap purchased last year for $204 million. That partially explains why shares traded as high as $17.25 this morning.
Now what: The proposed merger will bolster AT&T's spectrum position, although it will also attract regulatory scrutiny for the same reason. AT&T will also acquire Leap's customer base of approximately 5 million prepaid subscribers, strengthening its numbers in that market segment. The transaction will face the usual hurdles of shareholder votes, regulatory approvals, and other customer closing conditions, but AT&T hopes to seal the deal within six to nine months.
Interested in more info on Leap Wireless? Add it to your watchlist by clicking here.
It's incredible to think just how much of our digital and technological lives are almost entirely shaped and molded by just a handful of companies. Find out "Who Will Win the War Between the 5 Biggest Tech Stocks?" in The Motley Fool's latest free report, which details the knock-down, drag-out battle being waged by the five kings of tech. Click here to keep reading.
Friday, October 25, 2013
Now Is The Time To Buy PennWest
Editors' Note: This article discusses micro-cap stocks. Please be aware of the risks associated with these stocks.
PennWest (PWE), a Canadian oil and gas producer, has been underperforming due to poor asset management. In the last one year, the return on its stock is negative 15%. However, PennWest has laid down some concrete plans to usher its revival. The company has focused on the development of its acreage in the Cardium and Viking formations. With plans in place for development and production increase from these formations, we believe PennWest provides significant opportunity of growth for its investors.
Cardium Trend transitions
PennWest has around 600,000 net acres in the Cardium Trend in the Alberta region. The Cardium Trend formation lies beneath the Western Canadian Sedimentary Basin and contains reserves of oil and natural gas. The Cardium Trend formation stretches between the Canadian provinces of Alberta and British Columbia. The locations where Penn West is focusing to develop the Cardium Trend are Alder Flats, Lodgepole, and Crimson Lake. According to a study by Deloitte, the contingent reserve in the area under PennWest is around 1,007,721 million barrels of oil equivalent, or mboe. Contingent reserve is an estimation of the amount of petroleum that could be recovered and could be commercially developed.
PennWest is planning to increase the oil extraction from the Cardium Trend formation by increasing the use of secondary oil production techniques. Secondary recovery techniques happen after primary recovery techniques. Primary recovery techniques happen where hydrocarbons naturally rise to the surface. In the case of secondary production techniques, oil and natural gas are lifted by injecting water or gas into the wells and to increase reservoir productivity.
In the first half of this year, PennWest completed wells at selective places in the Alder Flats area using "slick water fracture" techniques, which resulted in more than 30% of well cost sav! ing over the first half of the previous year. The company plans on multiple programs in the region. "Slick water fracturing" techniques use a solution for fracturing layers by using fluids, which contains around 99.5% water and the rest is chemical added to the water to reduce friction, corrosion, and bacterial growth. Slick water fracturing results in fast and economic drilling because of injecting fluid into the well bore at high speed.
As the company has already tested well drilling capabilities in the Cardium Trend formation, it will give the company a better position to drill additional wells in the formation and increase its productivity. The company has around 3,000 net unrisked locations in the Cardium formation. Net unrisked locations refer to the total number of locations, including the ones where PennWest has partial interest, where production of oil and natural gas can be achieved. To exploit the potential of this region, PennWest is carrying out three water flood projects in the Cardium Trend by the end of this year. Water flooding is a secondary production technique to extract petroleum in which water is used to create pressure inside the reservoirs and extract petroleum. We expect that the water flood projects will continue to drive down well drilling and completion costs by the end of this year.
One of the major players in the Cardium formation is Bonterra Energy Corporation (OTC:BNEYF). The company has around 193.7 net sections in the Cardium formation with proved and probable reserves of around 70.5 mboe. Net sections are the total number of sections in a region that the company holds, including the ones in which the company has partial interests. In order words, it denotes the net operating area for a company that includes both productive and unproductive locations. The company plans to produce around an average of 12,000 boepd this year. The company produces around 75% oil and 25% of gas from the Cardium reservoirs with operating costs of around $13 per barrel o! f oil equ! ivalent, or BOE. With WTI prices around $100 per barrel, this results in a very high netback for the company. Netback measures the profit on a barrel when sold. During the second quarter ending in June, the company realized a netback of $43.52 per boe, which was a 15% increase quarter over quarter.
Playing in the Viking
PennWest is also focusing on growth from its Viking formation acreage. The Viking formation also lies in the Western Canadian Sedimentary Basin and stretches between Alberta and Saskatchewan. PennWest has around 822,680 gross acres in this region with around 1,000 net sections. According to the same study by Deloitte, the acreage owned by PennWest in the Viking play has a contingent reserve of around 170,997 mboe.
PennWest also plans to drill around 50 wells- 60 wells in this region by the end of this year. According to a study by the National Energy Board, or NEB, the depth of the Viking formation ranges between 600m to 900m; this is shallower than the other formations, which are found at depths more than 800m. We believe that the shallower depth of the Viking formation will lead to a lesser cost of well drilling due to the lower depth, which will be beneficial for the company. Also, the Viking formation has been reported to have around 9 million barrels of oil. The comparative low cost of drilling with a significant reserve will provide a platform for future growth to the company. The cost of a well in the Viking formation is around $1 million. The company estimates its drill completion equipment and tie-in cost of a well is around $1.1 million. At this, the well costs of PennWest are competitive with the market.
PennWest plans to continue with its primary recovery techniques as well as start with secondary production techniques in the Viking formation. Similar to its Cardium Trend plans, the company will initiate water flooding techniques in the Viking formation. We believe that the company's plan of a gradual transition into secondary production techniques wil! l help it! enhance its production from the Viking play over the coming quarters.
Looking at the potential of the two plays, we believe that it will provide PennWest with substantial room for growth. The company has reallocated it capital expenditure in the Cardium Trend as well as in the Viking Play. It has allocated around an additional $47 million in the Viking Play and $40 million in the Cardium Trend. This is as shown in the graph below:
(click to enlarge)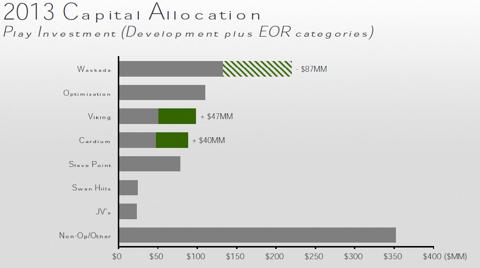
The capital reallocation will thus provide a boost to the development and production plans in both the Cardium Trend and Viking formations. We feel the company is allocating its capital more efficiently, which would result into better returns.
A focused player in the Viking formation is Raging River Exploration (OTC:RRENF). The company has a significant position in the Viking formation with around 84,000 net acres of land and around 600 net drilling locations. The company is focused on producing light oil from the Viking play. Raging River Exploration has already drilled around 100 wells out of the 140 wells it has planned for this year. The company increased its capital expenditure in this region from around $20 million to around $145 million for this year. With an increase in capital spending, the company has also increased the production target from this region around 4,850 barrels of oil equivalent per day, boepd, to around 5150 boepd, and around 95% of the production is oil.
Showing positive signals
PennWest currently has a return on asset, or ROA, of negative 1.41%, and its return on equity, or ROE, is around negative 2.90%. Though both ratios indicate a negative return, we believe that this is only transitional. On a medium to long-term basis, the company will reverse its revenue trend. As we have discussed PennWest's assets in the Cardium formation and in the Viking formation, which hold significant reserves for supp! orting pr! oduction growth. Additionally, PennWest has laid down plans to implement secondary production techniques to increase the productivity from its reserves. With further reallocation of capital in the Cardium and the Viking formation, the company has expedited the process of development in these two formations. We believe PennWest is looking for a turnaround of its returns from these assets.
Source: Now Is The Time To Buy PennWestDisclosure: I have no positions in any stocks mentioned, and no plans to initiate any positions within the next 72 hours. I wrote this article myself, and it expresses my own opinions. I am not receiving compensation for it (other than from Seeking Alpha). I have no business relationship with any company whose stock is mentioned in this article. (More...)
Additional disclosure: Fusion Research is a team of equity analysts. This article was written by Madhu Dube, one of our research analysts. We did not receive compensation for this article (other than from Seeking Alpha), and we have no business relationship with any company whose stock is mentioned in this article.
Thursday, October 24, 2013
Diversification Drives Nasdaq's Q3 Earnings, Future Outlook
NASDAQ OMX (NASDAQ:NDAQ) was already one of the most diversified exchange players in the U.S. prior to its acquisitions over the past year. Following these acquisitions, it is now an entity that is almost unaffected by the weakness in its most recognizable division, U.S. cash equity trading. NASDAQ reported its earnings for the third quarter on October 23, and recorded a 23% jump in its net revenue, primarily driven by the acquisitions. Organically, its revenue grew by 4% year-on-year as the U.S. cash equity trading business continued to lose market share and remained a drag.
Below we provide our take on the most important data released during the conference call. Our price estimate for the company’s stock is around $31, and we will update our model shortly.
Good Progress On Capital Plan
NASDAQ has spent over $1 billion in the last year to acquire fixed income platform eSpeed and Thomson Reuters’ corporate solutions business. The company had to take on a significant amount of debt for these deals, which initially raised concerns about its credit ratings. In Q2, its long-term debt obligations increased by $807 million from the end of 2012.
However, the company is committed to reducing its debt at an accelerated pace, and seems to be doing well on this front. It paid back $98 million of debt during the quarter, and remains on track to return to its long-term gross debt-to-EBITDA target of around 2.5x. As debt reduces, we expect NASDAQ’s financial flexibility to return, and the company is then likely to restart its share buyback program (read: NASDAQ Escapes Moody’s Review Without A Downgrade).
New Acquisitions Provide Diversification…
The hefty sum paid for Thomson Reuters’ business and eSpeed definitely seems to be benefiting NASDAQ in terms of diversification. Whereas the Thomson Reuters’ corporate business acquisition has strengthened its non-transaction based revenue, eSpeed has helped diversify transaction-bas! ed income by contributing fixed income revenues.
At the moment, cash equities trading accounts for just 9% of NASDAQ’s net revenue, while derivatives, fixed income, and access and broker services account for 14%, 4% and 13% respectively. Together, these segments comprise NASDAQ’s Market Services division, which is responsible for 40% of its topline. The other 60% comes from Technology Solutions (26% of revenue) and Information Services (23% of total net revenues), both of which provide recurring revenue from long-term client relationships (Press release, NASDAQ OMX, October 23, 2013). We expect the share of non-transaction based revenues to further increase as NASDAQ continues to roll out new products in the data and technology markets.
…And Are Likely To Drive Growth
In addition to providing diversification, the two new acquisitions also provide NASDAQ interesting growth opportunities.
According to NASDAQ’s management, the majority of its clients are currently using only one or two of its products in the corporate solutions market. With the acquisition of Thomson Reuters’ businesses, it has an opportunity cross sell to its clients and increase its revenue per client. The company has already started integrating Thomson’s platforms with its own, and is reorganizing its sales team to better serve its 10,000 customers globally. We expect NASDAQ’s corporate solutions revenue to grow rapidly as some of these initiatives start to have an impact.
The opportunity in the fixed income space is also large. With the acquisition of eSpeed, NASDAQ is now one of the leaders in the electronic government bond trading markets. During the quarter, over $3 trillion worth of U.S. fixed income products were traded on its platform every month, and the figure is likely to increase as it attracts new clients and launches new products. Since the close of the eSpeed acquisition, NASDAQ has already enrolled four new customers and expects to e! nroll ano! ther four by the end of 2013. The pace of new client enrollments could further increase once it finishes work on improving eSpeed’s responsiveness, a stated short-term goal.
Disclosure: No positions.
Source: Diversification Drives Nasdaq's Q3 Earnings, Future OutlookWednesday, October 23, 2013
In Their Own Words: How 8 Homebuilder CEOs Feel About the Housing Industry
Housing is making a big comeback. The numbers are hard to argue with. For years, we've built fewer homes than are needed to keep up with population growth, soaking up excess inventory from last decade's bubble and then some. Now, homebuilders have the wind at their back as construction booms. Housing starts are up more than 30% year over year.
But don't take my word for it. Here's what eight CEOs of the nation's biggest homebuilders said in conference calls that took place in the last three months.
Stuart Miller, CEO, Lennar (NYSE: LEN ) :
While production continues to lag the need, we are experiencing supply shortages against a growing demand. While some have argued that increased demand is being driven by low interest rates, we believe that it's being driven by a generally improving economy, driving household formation and a decoupling of households under one roof. New families are seeking to find independent shelter. Where attractive financing is available and obtainable, households seek for-sale product. But in the absence of a for-sale option, they seek rentals. But that just increases demand for rentals and drives up the rental rates, making for-sale monthly payments even more attractive. The bottom line is that there are too few dwellings for a growing population and for normalized household formation.
Larry Nicholson, CEO, Ryland Group:
Not a lot has been keeping me up at night. The interest rate thing ... as long as the economy continues to move forward on solid ground, I think we are fine. A year ago I was worried about Fannie and Freddie, but today I am not. There is mortgage availability. So I am not real concerned with a whole lot right now. I think that pricing will continue to move up. If you look at peak-to-trough pricing and you look at where we are today, we still got room to move. So I think there is a lot of things still playing to our favor today.
Donald Tomnitz, CEO, DR Horton (NYSE: DHI ) :
We're dramatically improving our margins. We think we're in a wonderful position. There is a shortage of finished homes on the marketplace. So not only with our good inventory of specs that we consistently have maintained in this company, we will continue to push price as well as volume. Clearly we've said before, our goal is, improve the bottom line better than we improve the top line. But nevertheless, we are in a position where we can do both.
Jeffrey Mezger, CEO, KB Homes (NYSE: KBH ) :
Let me address the recent concerns many have raised regarding the recent uptick in mortgage rates and its potential impact on housing. In my view, there is no question that housing dynamics are significantly better than they were a year ago. At the same time, in my view, we are still in the early innings of a recovery that is continuing to accelerate. The positive factors underpinning the current housing recovery remain fully in place and will continue to drive favorable market fundamentals.
There is substantial pent-up demand driven by population growth, job growth, an increase in household formation and record affordability. At the same time, in most areas of the country, there is a shortage of supply and monthly mortgage payments for a typical home are lower than rent; further reinforcing the appeal of homeownership. Despite the recent rise in rates, affordability is still at extraordinary levels, and demand is significantly outpacing supply in every market we serve. Anecdotally, we are hearing from the sales floor that the uptick in rates has actually created an increased sense of urgency, as buyers don't want to miss out on this incredible opportunity.
Larry Mizel, CEO, MDC Holdings (NYSE: MDC ) :
So I think that the United States is in a unique place where it's a safe haven for capital. As we look around the world, there's not a lot of safe havens. And so housing benefits from the pent-up demand. It benefits from the low interest rates. And the home value and the affordability, as you know that the affordability is well imbalanced, and there seems to be room to run between the cost and what the affordability index would anticipate. And so I think the industry is working hard to expand to meet the demand and the needs of the buyer. We're creating jobs, which is great for our country. We're helping the GDP, which is certainly lacking in many areas. So I think the aggregate impact of providing housing and value is working out very well for everyone.
Richard Dugas, CEO, PulteGroup (NYSE: PHM ) :
In a number of communities across the country, demand has been so strong that we have taken action to slow the overall pace of sales. While I would expect that everyone listening to the call today is aware of builders taking such action in Phoenix, Tampa and Washington D.C., we are now seeing this in cities as diverse as Austin, Cleveland and Seattle. In fact, while it's tough to get precise data, a recent survey of our division president suggests that we have taken steps to purposefully slow sales to varying degrees in 25% or more of our communities. I am sure that most of you know the answer, but why would we limit sales? Given the lack of land development during the 6 years of housing market downturn, finished lots in the better submarkets are scarce. Accelerating sales pace means that we sellout a neighborhood sooner and have to look to the next community which may not have been developed yet. Although less of an influence, labor constraints in certain markets can also make it prudent to meter the sales pace to help ensure build times are not extended too far into the future.
Ara Hovnanian, CEO, Hovnanian (NYSE: HOV ) :
In the majority of the situations, we have been able to raise our home prices more than the construction costs have increased, thereby increasing gross margin. Southern and Northern California, as well as Phoenix, certainly have many communities that fall into that category. In other markets, we've been able to raise prices -- home prices equal to construction cost increases. Houston and Dallas are examples of that. And finally in some markets, the construction cost increases have actually risen ahead of our community home price increases. This is in a minority of the markets, but Minneapolis comes to mind in this category. Fortunately, home prices are gaining momentum here as well. In the aggregate, our home price increases have more than offset any increases in construction costs that we have seen to date, helping contribute to our gross margin increase.
Ara Hovnanian, CEO, Hovnanian:
While the housing market is clearly recovering, we have not yet reached the level of the previous lows of 1 million starts. All of the excess production of mid-decade has now been wiped out by the deficit production plus a little. In fact, on Slide 26, we show the excess starts from the last decade and stack them -- excess above the average, stack them on top of the deficit reduction of the last 5 years, and what you see is that the -- we are still far below the average production for the decade. As has often happened, the market has overcorrected, and on -- in this case, on the downside. In addition, like the '70s, most demographers are projecting higher housing needs this particular decade, based on population and household growth. The Harvard Joint Center for Housing Studies, Moody's and others, are projecting housing starts between 1.6 million and 1.9 million new home starts per year for the entire decade. This exacerbates the current underproduction issues.
Steve Hilton, CEO, Meritage Homes:
As much as prices have gone up, affordability is still at a historic low, of course a lot of that is because of interest rates. Sooner or later rates are going to go up, and so we have to be mindful that and I think we are, and that's why we are focused on more A&B locations than going into the outer markets. I think the thing that people aren't really talking a lot about is that the entry level business, at least from my vantage point, really has been recovered to the degree that the mover market is and the interest and see what happens out there, but affordability is one metric to watch, and we still feel very good about it.
Hat tip to SeekingAlpha.com for providing conference call transcripts.
More from the Motley Fool
Interested in more about the economy? My new free report, "Everything You Need to Know About the National Debt," walks you through with step-by-step explanations about how the government spends your money, where it gets tax revenue from, the future of spending, and what a $16 trillion debt means for our future. Click here to read it.
Tuesday, October 22, 2013
Tile Shop Holdings (TTS): Ready to Crack or a Short Squeeze? LL, HD & LOW
The shorts appear to be trying to crack small cap Tile Shop Holdings, Inc (NASDAQ: TTS) – meaning it might be worth taking a realistic look at the stock and any potential problems surrounding it plus the performance of other home improvement retailers or peers like Lumber Liquidators Holdings Inc (NYSE: LL), which is not into tiles, and The Home Depot, Inc (NYSE: HD) and Lowe's Companies, Inc (NYSE: LOW) which would be into tiles.
What is Tile Shop Holdings?Small cap Tile Shop calls itself a leading specialty retailer of manufactured and natural stone tiles, setting and maintenance materials and related accessories in the United States. Specifically, the Tile Shop says it offers a wide selection of products, good value and enhanced customer service in a unique showroom setting. As of June 30, The Tile Shop operated 80 stores in 25 states, with stores having an average footprint of 23,000 square feet.
What You Need to Know About Tile Shop HoldingsOn Monday, an anonymous author calling him or herself the Infitialis Research Collective, published an article on Seeking Alpha entitled: The Tile Shop: Poisoned Tile, Bad Actors, Unsustainable Margins, And A Stock Ready To Crack. The numerous accusations hurled at the company included:
Independent laboratory testing results indicating that a "significant number of The Tile Shop products have DANGEROUS lead contaminations, up to 13,900% greater than the United States' Consumer Product Safety Commission limits for products that come in contact with children." The company's current management team is "wholly unfit for public company stewardship with a Founder/CEO convicted of FRAUD and the SVP of Operations is presently out on PROBATION." The Chan Brothers, with their "dubious and notorious lineage in Hong Kong real estate, have been selling down their ~30% ownership stake." Unsustainable margins for a commodity product.Of course and while the report looks pretty slick and is crammed full of "facts," info or just plain insinuations, the article also comes with the disclosure "I am short TTS," which might tell you everything you need to know about the motivations of the author. In addition, the name of the independent lab is not mentioned (you can bet if there is smoke, we will soon see some fire in the form of press releases from trial lawyers and consumer or "shareholder rights activists" investigating the company) while The Home Depot and Lowe's Companies would also be sourcing tiles and probably sourcing them from the same overseas sources (meaning they would face the same potential lead liabilities).
Investors can read the report from Infitialis Research Collective and form their own opinion but here are some facts that we do know about Tile Shop Holdings:
Insiders were selling shares for much of last summer according to Yahoo! Finance data, but the last transaction was a buy at the beginning of the month. There is no trailing P/E but the company's forward P/E is 36.60 according to Yahoo! Finance data. The company does have aggressive growth plans as the number of new stores expected to open in 2013 was raised to 20 from 17 (in the last earnings call). In 2014, the company anticipates opening approximately 25 stores. The last time the company reported earnings, comp store sales were up 14.3% in the second quarter and total sales were up 25.59% with two-thirds of the sales growth driven by ticket and the other third by increased store traffic.In the last earnings call (the transcript is available on Seeking Alpha here), the SVP of retail noted:
Our strategy for continuing to grow sales in built on four pillars, first opening stores in market with suitable demographics. Second, leveraging our strength to take market share from the competition. Third, offering a vast selection of products incredibly presented to grab consumers from the moment they walk through our doors, and fourth, early training our sales managers and their associates to deliver exceptional customer service.
Share Performance: Tile Shop Holdings vs. LL, HD and LOWOn Monday, small cap Tile Shop Holdings fell 8.04% to $23.79 (TTS has a 52 week trading range of $12.00 to $30.88 a share) for a market cap of $1.32 billion but the stock is up is up 40.3% since the start of the year, up 61.8% over the past year and up 94.2% since August 2012.
Here is a quick look at Tile Shop Holdings' performance verses that of Lumber Liquidators Holdings and mass market home improvement stores The Home Depot and Lowe's Companies:
As you can see from the above chart, both the Tile Shop Holdings and Lumber Liquidators Holdings have far outperformed both The Home Depot and Lowe's Companies over the long term albeit the performance of TTS has come back down to earth.
Finally, here is a look at the latest technical charts for all four home improvement stocks:
The Bottom Line. Again, investors should be cautious about acting on a report (no matter how good it looks) written by someone shorting a stock just like they should also be careful about buying a stock based on a report written by a shareholder, but it will be interesting to see how the company responds to the article. With that said and while Tile Shop Holdings has put in a pretty good performance verses other home improvement stocks, it may not be compelling enough to get into right now – other than to squeeze shorts like the Infitialis Research Collective.
Stocks breaking the all-time high barrier
A large and growing number of stocks are hitting all-time highs along with the broad market — a sign of underlying strength that could portend more gains ahead.
All told, 106 stocks in the Standard & Poor's 500 are at or within 2% of their all-time highs, a commentary on how the market isn't being held up by just a few runaway winners, but a swell of companies from a swath of industries that are hitting their strides.
Seeing broad leadership instead of just a few darlings comes as the S&P 500 on Tuesday hit another all-time high, the fourth in a row, capping a 23% gain this year. "We are nowhere near a market top because this rally has real internal strength in it," says Ken Winans of Winans Investments. "This bull run has room to run."
STOCKS: S&P rises to fourth consecutive record close
ASK MATT: Is S&P 500 good place to start investing?
A closer look at the companies at or approaching highs show that:
• Well-known consumer brands are big winners. Disney, Chipotle Mexican Grill and Starbucks are among the stocks that have blown the furthest into record ground. All three set new all-time highs Tuesday.
• The number of stocks hitting highs is at historic levels. More than 800 stocks trading on the New York Stock Exchange and the Nasdaq are at their highest levels over the past year, Winans says. Seeing that many stocks hit 52-week highs at the same time has only happened five other times since 1974, including 1982, 1986, 1997, 2003 and 2010, Winans says. Each of these periods were followed with powerful rallies.
• They're not just the individual investor darlings. The companies that are blazing with the most gusto aren't the high-profile tech stocks that individual investors have been infatuated with, but lesser-known companies such as industrial coatings maker PPG, hard drive makers Seagate and Western Digital, shipper United Parcel Service, defense company Northrop Grumman and discount retailers TJX and Dollar Tree. On the other ! hand, Apple, a favorite stock among individual investors, is still 26% away from its all-time high of $705 set last year.
• Former stars of last market high left out. Stocks such as Cisco Systems, JDS Uniphase and Yahoo were the pace leaders when the market last raced to new highs in the late 1990s. But all these stocks are nowhere near their all-time highs, remaining 72%, 99% and 73% away from new ground, respectively. Some former darlings, though, have returned for encore performances, including online retailers Amazon.com, which set an all-time high Tuesday, and Priceline.com, which is 2% away from its high.
Seeing so many companies hit all-time highs "is a very healthy sign and one that should encourage further buying," says Jack Ablin of BMO Private Bank.
S&P 500 stocks up the most from their previous all-time highs:
• PPG Industries, 1.8%
• Walt Disney, 1.6%
• Chipotle Mexican Grill, 1.6%
• Scripps Networks Interactive, 1.4%
• FedEx, 1.4%
Source: S&P Capital IQ, USA TODAY research
DIRECTV Stock Goes for a Hulu Boost
The Hulu sweepstakes is intensifying, and at least one source claims that DIRECTV (NASDAQ: DTV ) is the leading bidder. Digital journalist Quartz is reporting that the country's leading satellite television provider has the inside track on the winning bid for the TV-centric streaming service provider, and the pairing makes sense.
DIRECTV stock is trading closer to its all-time high than its low these days, but it will face challenges in the near future for which Hulu would come in handy.
DIRECTV isn't just the largest satellite television service in the Americas. It also happens to be the most expensive. Over the past year, the average stateside subscriber has gone from paying $91.99 to $96.05 a month. Its closest rival -- DISH Network (NASDAQ: DISH ) -- commands monthly average ransoms of just $78.54 a month.
A key differentiator for DIRECTV is its exclusivity among satellite and cable providers with the NFL to provide every game during the regular season with its Sunday Ticket package. However, as NFL fees continue to spike, there are no guarantees that the deal will be renewed after the 2014 season. DIRECTV will want to start beefing up its proprietary offerings outside NFL Sunday Ticket, and offering Hulu Plus access to subscribers at no additional cost would be one way to command a premium over similar pay-TV alternatives.
Analysts see revenue at DIRECTV growing at a nearly 8% clip this year and again in 2014. It's a different story at DISH, with those same pros targeting top-line growth in the low single digits. If DIRECTV loses football exclusivity, what will it do to keep people paying up for its service come 2015?
The move would also give DIRECTV a service that it could use to defend itself against Netflix (NASDAQ: NFLX ) . It's not a coincidence that Netflix chose Latin America and the Caribbean as its first expansion market outside North America for its streaming service a couple of years ago. DIRECTV is the top dog through Latin America.
It's a different game for DIRECTV in Latin America, as average revenue per user breaks down to just $54.23. Currency fluctuations aside, the annual increases aren't the same in Latin America, as it reaches out beyond the affluent for middle-market customers. We're not at the point where cord-cutting is a trend in Latin America, but DIRECTV doesn't want to be on the wrong end of the digital trend if streaming video becomes a difference-maker. Acquiring Hulu -- and naturally beefing up its Spanish and Portuguese licensed content -- would help it compete with Netflix's platform.
Paying too much for Hulu may sting some potential bidders, but DIRECTV stock would probably move higher if the company does indeed emerge victorious, because it makes tactical sense.
DIRECTV stock can't ignore the future
The television landscape is changing quickly, with new entrants such as Netflix disrupting traditional networks. The Motley Fool's new free report "Who Will Own the Future of Television?" details the risks and opportunities in TV. Click here to read the full report!
Monday, October 21, 2013
10 Best Energy Stocks To Invest In 2014
On Wednesday, Chesapeake Energy (NYSE: CHK ) will release its latest quarterly results. The key to making smart investment decisions on stocks reporting earnings is to anticipate how they'll do before they announce results, leaving you fully prepared to respond quickly to whatever inevitable surprises arise. That way, you'll be less likely to make an uninformed knee-jerk reaction to news that turns out to be exactly the wrong move.
Chesapeake has been a major natural gas and oil producer for years, but it has faced several controversial episodes with its founder and former CEO Aubrey McClendon along the way. Now that McClendon has stepped down, investors are wondering which direction the company will move. Let's take an early look at what's been happening with Chesapeake Energy over the past quarter and what we're likely to see in its quarterly report.
Stats on Chesapeake Energy
Analyst EPS Estimate
10 Best Energy Stocks To Invest In 2014: National-Oilwell Inc.(NOV)
National Oilwell Varco, Inc. designs, constructs, manufactures, and sells systems, components, and products used in oil and gas drilling and production; provides oilfield services and supplies; and distributes products, and provides supply chain integration services to the upstream oil and gas industry worldwide. Its Rig Technology segment offers offshore and onshore drilling rigs; derricks; pipe lifting, racking, rotating, and assembly systems; rig instrumentation systems; coiled tubing equipment and pressure pumping units; well workover rigs; wireline winches; wireline trucks; cranes; and turret mooring systems and other products for floating production, storage and offloading vessels, and other offshore vessels and terminals. The company?s Petroleum Services & Supplies segment provides various consumable goods and services to drill, complete, remediate, and workover oil and gas wells and service pipelines, flowlines, and other oilfield tubular goods. It also manufacture s, rents, and sells products and equipment for drilling operations, including drill pipe, wired drill pipe, transfer pumps, solids control systems, drilling motors, drilling fluids, drill bits, reamers and other downhole tools, and mud pump consumables. In addition, this segment provides oilfield tubular services comprising the provision of inspection and internal coating services; equipment for drill pipe, line pipe, tubing, casing, and pipelines; and coiled tubing pipes and composite pipes. Its Distribution Services segment sells maintenance, repair and operating supplies, and spare parts to drill site and production locations. The company primarily serves drilling contractors, shipyards and other rig fabricators, well servicing companies, pressure pumping companies, oil and gas companies, supply stores, and pipe-running service providers. National Oilwell Varco, Inc. was founded in 1862 and is based in Houston, Texas.
Advisors' Opinion:- [By Chris Neiger]
1. National Oilwell Varco (NYSE: NOV ) -- Diversity score of 15: This oil and gas component and equipment company received the third-lowest rating in the report, partly because it was one of only two companies in the study that doesn't have any diversity on its board of directors. In addition, National Oilwell Varco has no women or minorities in the C-suite, as a Forbes overview on the report noted earlier this year. . When it comes to diversity, oil and gas companies typically tend to fall behind other industries.
- [By Harlan Kessler]
Whenever you see a company that is undervalued with plenty of competitive advantages and financial strength, you are looking at a winner. The company that meets these specifications in the energy business is National Oilwell Varco (NOV). The company supplies drillers and producers with anything they need ranging from rigs to drilling parts and also provides a range of services, whether it is piping inspection or the training of drilling crew in the use of sophisticated systems. It exerts such a profound influence that, according to a Morningstar estimate, it has a 60% share in the market for rig equipment and 90% of all rigs carry some of its equipment. It also operates in over 700 locations across the world. We should remember that the folks who made the real money in the Gold Rush were the suppliers of picks and shovels.
- [By Selena Maranjian]
Among holdings in which Fred Alger Management increased its stake were Two Harbors Investment (NYSE: TWO ) and National Oilwell Varco (NYSE: NOV ) . The company reduced its stake in lots of companies, including Questcor�and Weatherford. Two Harbors is a mortgage REIT, or "mREIT," recently yielding a gargantuan 11.4%. It's a "hybrid" mREIT, though, investing in both government agency-backed mortgages and ones that are not so backed. Thus, it has more flexibility than some of its peers. Some worry about rising interest rates and prepayments on loans, but Two Harbors has apparently hedged against some of that. Insiders and institutions�have been buying shares in recent months.
10 Best Energy Stocks To Invest In 2014: Whitehaven Coal Ltd (WHITF)
Whitehaven Coal Limited (Whitehaven) is engaged in the development and operation of coal mines in New South Wales. During the fiscal year ended 30 June 2012 (fiscal 2012), Whitehaven Coal Limited and its controlled entities continued development at the Narrabri underground mine. The Company operates in two segments: Open Cut Operations and Underground Operations. The Company�� Gunnedah operations include the Tarrawonga (70% owned by Whitehaven), Rocglen (100% owned by Whitehaven), and Sunnyside (100% owned by Whitehaven) open cut mines and the Gunnedah coal handling and preparation plant and train load out facility (CHPP��(100% owned by Whitehaven). The Werris Creek mine is 100% owned by Whitehaven. During fiscal 2012, the Company produced 4.28 million tons per annum of saleable coal. On May 1, 2012, the Company acquired Boardwalk Resources Limited. On May 2, 2012, the Company acquired Aston Resources Limited. On June 20, 2012, it acquired Coalworks Limited.Top 5 Energy Companies To Watch In Right Now: Statoil ASA (STO)
Statoil ASA (Statoil), incorporated on September 18, 1972, is an integrated energy company primarily engaged in oil and gas exploration and production activities. As of December 31, 2011, the Company had business operations in 41 countries and territories. Effective from January 1, 2011, the Company�� segments were Development and Production Norway; Development and Production International; Marketing, Processing and Renewable Energy; Fuel & Retail, Other. As of 31 December 2011, the Company had proved reserves of 2,276 million barrels (mmbbl) and 3,150 billion cubic meters (bcm) (equivalent to 17,681 trillion cubic feet (tcf)) of natural gas, corresponding to aggregate proved reserves of 5,426 mmboe. In December 2011, the Company acquired Brigham Exploration Company. On April 14, 2011, Statoil's formation of a joint venture and sale of 40% of the Peregrino field off the coast of Brazil to the Sinochem Group was closed. With effect from January 2011, Statoil formed a joint venture with PTTEP of Thailand in its oil sands business and, as part of that transaction, sold PTTEP a 40% interest in the leases in Alberta, Canada. Statoil retains 60% ownership and operatorship of the oil sands project. In June 2012, the Company divested its 54% interest in Statoil Fuel & Retail ASA to Alimentation Couche-Tard.
Development and Production Norway
Development and Production Norway (DPN) consists of the Company�� field development and operational activities on the Norwegian continental shelf (NCS). Development and Production Norway is the operator of 44 developed fields on the NCS. Statoil's equity and entitlement production on the NCS was 1.316 mmboe per day in 2011, which was about 71% of Statoil's total production. Acting as operator, DPN is responsible for approximately 72% of all oil and gas production on the NCS. In 2011, its average daily production of oil and natural gas liquids (NGL) on the NCS was 693 mboe, while its average daily gas production on the NCS was 99.1 mmcm (3.5 b! illion cubic feet (bcf)). The Company has an ownership interests in exploration acreage throughout the licensed parts of the NCS, both within and outside its production areas. It participates in 227 licenses on the NCS and is the operator for 171 of them. As of 31 December 2011, Statoil had a total of 1,369 mmbbl of proved oil reserves and 444 bcm (15.7 tcf) of proved natural gas reserves on the NCS. Total entitlement liquids and gas production in 2011 amounted to 1,316 mmboe per day.
Statoil's NCS portfolio consists of licenses in the North Sea, the Norwegian Sea and the Barents Sea. It has organized its production operations into four business clusters: Operations South, Operations North Sea West, Operations North Sea East and Operations North. The Operations South and Operations North Sea West and East clusters cover its licenses in the North Sea. Operations North covers the Company�� licenses in the Norwegian Sea and in the Barents Sea, while partner-operated fields cover the entire NCS and are included internally in the Operations South business cluster. During 2011, it two Statoil-operated oil discoveries: the Aldous discovery (PL265) in the North Sea and the Skrugard discovery (PL532) in the Barents Sea. The Aldous Major South discovery in PL265 on the Utsira Height in the Sleipner area is situated 140 kilometers west of Stavanger and 35 kilometers south of the Grane field. The Skrugard discovery is located about 250 kilometers off the coast from the Melkoya LNG plant in Hammerfest.
As of December 31, 2011, the Company�� fields under development included the Gudrun, Valemon, Visund South, Hyme, Stjerne, Vigdis North-East, Skuld, Vilje South, Skarv, and Marulk. In 2011, the Company�� total entitlement oil and NGL production in Norway was 252 mmbbl, and gas production was 36.2 bcm (1,287 bcf). The main producing fields in the Operations South area are Statfjord, Snorre, Tordis, Vigdis, Sleipner and partner-operated fields. Operations North Sea East is a gas area tha! t also co! ntains quantities of oil. The area includes the Troll, Fram, Vega, Oseberg and Tune fields. The Company�� producing fields in the Operations North area are Asgard, Mikkel, Yttergryta, Heidrun, Kristin, Tyrihans, Norne, Urd, Alve, Njord, Snohvit and Morvin.
Development and Production International
Development and Production International (DPI) is responsible for the development and production of oil and gas outside the Norwegian continental shelf (NCS). In 2011, the segment was engaged in production in 12 countries: Canada, the United States, Brazil, Venezuela, Angola, Nigeria, Iran, Algeria, Libya, Azerbaijan, Russia and the United Kingdom. In 2011, DPI produced 28.9% of Statoil's total equity production of oil and gas. Statoil has exploration licenses in North America (Gulf of Mexico, Canada and Alaska), South America and sub-Saharan Africa (Brazil, Cuba, Suriname, Venezuela, Angola, Mozambique and Tanzania), Middle East and North Africa (Libya and Iran) and Europe and Asia (the Faeroes, Greenland, the United Kingdom, Azerbaijan and Indonesia). The main sanctioned development projects in which DPI is involved are in the United States, Angola and Canada. The Brigham Exploration Company acquisition added production of approximately 21 mboe per day (as of December) to Statoil's production and gave access to 1,500 square kilometers (375,000 acres) in the Bakken and Three Forks formations in the Williston Basin.
The Company has exploration licenses in North America (Gulf of Mexico, Canada and Alaska), South America and sub-Saharan Africa (Brazil, Cuba, Suriname, Venezuela, Angola, Mozambique and Tanzania), Middle East and North Africa (Libya and Iran), and Europe and Asia (the Faroes, Greenland, the United Kingdom, Azerbaijan and Indonesia). It completed 16 wells in 2011. Five were announced as discoveries: the Mukuvo and Lira discoveries in Angola, the Gavea and Peregrino South discovery in Brazil and the Logan discovery in Gulf of Mexico (GoM). Statoil acquired in! terests i! n six new licenses in Indonesia in 2011. Statoil has activities in the United States, with approximately 300 exploration leases in the GoM and 66 in Alaska. It is also an operator and partner in exploration licenses off the coast of Newfoundland in Canada. Statoil is operator and partner in exploration licenses off the coast of Newfoundland (11,138 square kilometers). It has exploration licenses in Brazil, Cuba, Suriname, Venezuela, Angola, Mozambique and Tanzania. The Company has licenses in Libya, Iran, Faroes, Greenland, the United Kingdom, Azerbaijan and Indonesia. In 2011, Statoil's petroleum production outside Norway amounted to an average of 334 mboe per day of entitlement production and 534 mboe per day of equity production.
The Company has activities in the United States Gulf of Mexico, the Appalachian region, south-west Texas, the Williston Basin, off the East Coast of Canada and in the oil sands of Alberta, Canada. It also has a representative office in Mexico City. Offshore, the Company has production interests in Hibernia and Terra Nova, and interests in two development projects. Its development and production activities in South America and sub-Saharan Africa comprise the Peregrino operatorship in Brazil, the Petrocedeno project in Venezuela, the Agbami offshore field in Nigeria and four Angolan offshore blocks. Statoil's development and production in the Middle East and North Africa in 2011, primarily encompassed Algeria, Libya, Egypt, Iran and Iraq. The Company�� Development and Production in Europe and Asia primarily comprises Azerbaijan, Russia, United Kingdom and Ireland.
Marketing, Processing and Renewable Energy
Marketing, Processing and Renewable Energy (MPR) is responsible for the transportation, processing, manufacturing, marketing and trading of crude oil, natural gas, liquids and refined products, and for developing business opportunities in renewables. It runs two refineries, two gas processing plants, one methanol plant and three crude! oil term! inals. MPR is also responsible for marketing gas supplies originating from the Norwegian state's direct financial interest (SDFI). In total, it is responsible for marketing approximately 80% of all Norwegian gas exports. In 2011, Statoil sold 36.1 bcm (1.3 tcf) of natural gas from the Norwegian continental shelf (NCS) on its own behalf, in addition to approximately 33.5 bcm (1.2 tcf) of NCS gas on behalf of the Norwegian state. Statoil's total European gas sales, including third-party gas, amounted to 79.8 bcm (2.9 tcf) in 2011, of which 39.5 bcm (1.4 tcf) was gas sold on behalf of the Norwegian state. The Natural Gas business cluster is responsible for Statoil's marketing and trading of natural gas worldwide, for power and emissions trading and for overall gas supply planning. In 2011, the Company sold 36.1 bcm (1.3 tcf) of natural gas from the NCS on its own behalf, in addition to approximately 33.5 bcm (1.2 tcf) of NCS gas on behalf of the Norwegian state. Statoil's total European gas sales, including third-party gas, amounted to 79.8 bcm (2.9 tcf) in 2011, of which 39.5 bcm (1.4 tcf) was gas sold on behalf of the Norwegian state. In addition, it sold 5.5 bcm (0.2 tcf) of gas originating from its international positions, mainly in Azerbaijan and the United States, of which 2.7 bcm (0.1 tcf) was entitlement gas. As technical service provider (TSP), Statoil is responsible for the operation, maintenance and further development of the Karsto gas processing plant on behalf of the operator Gassco.
Statoil is the seller of crude oil, operating from sales offices in Stavanger, Oslo, London, Singapore, Stamford and Calgary and selling and trading crude oil, condensate, NGL and refined products. Statoil holds the lease for the South Riding Point crude oil terminal in the Bahamas, which includes, oil storage as well as loading and unloading facilities. It also operates the Mongstad terminal and has shared ownership with Petoro. The Company is a majority owner (79%) and operator of the Mongstad ref! inery in ! Norway, which has a crude oil and condensate distillation capacity of 220,000 barrels per day. It is the sole owner and operator of the Kalundborg refinery in Denmark, which has a crude oil and condensate distillation capacity of 118,000 barrels per day. In addition, it has rights to 10% of production capacity at the Shell-operated refinery in Pernis in the Netherlands, which has a crude oil distillation capacity of 400,000 barrels per day. The Company�� methanol operations consist of an 81.7% interest in the gas-based methanol plant at Tjeldbergodden, Norway, which has a design capacity of 0.95 million tons per year. It also operates the Oseberg Transportation System (36.2% interest), including the Sture crude oil terminal.
Technology, Projects and Drilling
Technology, Projects and Drilling (TPD) is responsible, as a global service provider to Statoil, for delivering projects and wells and for providing support through global expertise, standards and procurement. TPD is also responsible developing and implementing new technological solutions. Statoil's research and development portfolio is organized in seven programs covering the upstream building blocks. The research and development organization operates and develops laboratories and test facilities and has an academia program that addresses cooperation with universities and research institutes.
Global Strategy and Business Development
Global Strategy and Business Development (GSB) was established in 2011, with its main office in London. GSB sets the direction for Statoil and identifies, develops and delivers opportunities for global growth.
Advisors' Opinion:- [By David Smith]
Despite Craighead's relative ebullience regarding North America, it nevertheless appears that the sizzle at Baker Hughes lies in the international markets. As I noted last week, the company has teamed up with CGGVeritaz (NYSE: CGG ) to add substantial seismic capabilities to its global repertoire. Further, it's working with Norway's Statoil (NYSE: STO ) on new projects in the North Sea, the Norwegian Sea, and the Barents Sea. It's also been contracted by Chevron (NYSE: CVX ) for work on the giant Gorgon project in Australia, and its gearing up with Russia's Lukoil and Statoil on the West Qurna-2 oil fields in Iraq.
- [By Tyler Crowe]
Ultimately, the pipe got back up and running again, and prices subsided. For many people in the U.K., there was a big sigh of relief. What Europe should consider, though, is the much deeper underlying threat: the delicacy of global energy markets and the threats it poses if a country is not energy independent. Russia's Gazprom and Norway's Statoil (NYSE: STO ) �supply�40% of Europe's natural gas.�With so much supply coming from only two sources, Europe is at severe risk if either of these companies suffers a technical (or political) problem. The only way that Europe can solve this problem is to find a more diverse source of natural gas.�
- [By Sara Murphy]
HSBC recently conducted an analysis that looked at European oil majors' at-risk carbon reserves. The study found Norway's�Statoil (NYSE: STO ) �to be the worst affected, with approximately 17% of its market capitalization at risk. HSBC also calculated that 6% of�BP's� (NYSE: BP ) reserves are at risk, along with 5% of�Total's (NYSE: TOT ) and 2% of�Shell's� (NYSE: RDS-A ) .�
10 Best Energy Stocks To Invest In 2014: First Power and Light Inc (VOLT.PK)
First Power and Light, Inc. (FPL), formerly Mainstream Entertainment, Inc., incorporated on June 24, 2008, is a full service solar installation company. The Company is engaged in the financing, design, installation and maintenance of small to large scale solar installations. The Company�� services include residential, commercial and solar farms.
As of July 22, 2013, the Company has completed over 400 commercial, Federal Government and residential installations. The Company has developed software. Its monitoring software provides both the Company and its customers with a view of their energy generation, consumption and carbon offset through an application available on smart-phones and any device with a Web browser.
10 Best Energy Stocks To Invest In 2014: IHS Inc. (IHS)
IHS Inc. (IHS), incorporated on May 5, 1994, is a source of information and insight in areas, such as energy and power; design and supply chain; defense, risk, and security; environment, health and safety (EHS) and sustainability; country and industry forecasting, and commodities, pricing, and cost. The Company is organized by geographies into three business segments: Americas, which includes the United States, Canada, and Latin America; EMEA, which includes Europe, the Middle East, and Africa, and APAC (Asia Pacific). IHS sources data and transforms it into information and insight that businesses, Governments, and others use every day to make decisions. Its product development teams have also created Web services and application interfaces. These services allow its customers to integrate the Company�� information with other data, business processes and applications (computer-aided design, enterprise resource planning, supply chain management, and product data/lifecycle management). The Company develops its offerings based on its customers' workflows, and it sells and delivers them into the industries in which IHS�� customers operate. As of November 30, 2011, HIS focused on five customer workflows: strategy, planning, and analysis; energy technical; product engineering; supply chain, and EHS & sustainability. As of November 30, 2011, it was focused on six verticals: energy and natural resources; Government, defense and security; chemicals; transportation; manufacturing, and technology, media, and telecommunications. In March 2012, the Company acquired Displaybank, a global authority in market research and consulting for the display industry; the Computer Assisted Product Selection (CAPSTM) electronic components database and tools business, including CAPS Expert, from PartMiner Worldwide, and the digital oil and gas pipeline and infrastructure information business from Hild Technology Services. In March 2012, the Company acquired IMS Research. In March 2012, the Company acquired BDW Automotive GmbH. I! n May 2012, it acquired Xedar Corporation, a developer and provider of geospatial information products and services. In July 2012, the Company acquired CyberRegs business from Citation Technologies, Inc. In July 2012, the Company acquired GlobalSpec, Inc. On April 16, 2011, IHS acquired ODS-Petrodata (Holdings) Ltd. ODS-Petrodata is a provider of data, information, and market intelligence to the offshore energy industry. On April 26, 2011, it acquired Dyadem International, Ltd. (Dyadem). Dyadem offers operational risk management and quality risk management solutions. On May 2, 2011, the Company acquired Chemical Market Associates, Inc. (CMAI). CMAI is a leading provider of market and business advisory services for the worldwide petrochemical, specialty chemicals, fertilizer, plastics, fibers, and chlor-alkali industries. On August 10, 2011, the Company acquired Seismic Micro-Technology (SMT). SMT offers Windows-based exploration and production software, and its solutions are used by geoscientists worldwide to evaluate potential reservoirs and plan field development. On November 10, 2011, it acquired Purvin & Gertz. Purvin & Gertz is a global advisory and market research firm that provides technical, commercial, and strategic advice to international clients in the petroleum refining, natural gas, natural gas liquids, crude oil and petrochemical industries. Energy and Power IHS covers the technical and economic spectrum of energy and power. Detailed records and forecasts on oil, gas and coal supplies, combined with insights on traditional and emerging energy markets, help enable its customers to make decisions. Its offerings include production information on more than 90 % of the world's oil and gas production in more than 100 countries; oil and gas well data that includes geological information on more than four million current and historic wells worldwide; energy activity data that includes current and future seismic, drilling and development activities in more than 180 countries and 335 hydrocarbon-producing regions worldwide; information and research to develop unconventional hydrocarbon resources-shale gas, coal bed methane and heavy oil; knowledge of energy markets, strategies, industry trends, and companies; information and research summits, such as IHS CERAWeek and the IHS Herold Pacesetters Energy Conference, which offer decision makers the opportunity to interact with its experts, and critical information about analysis of coal, nuclear and renewables, including wind, solar, and hydro power. The Company competes with DrillingInfo, Inc., TGS-NOPEC Geophysical Company, Deloitte Touche Tohmatsu Limited, Accenture, Deloitte, Wood Mackenzie, Ltd., Schlumberger Limited, Halliburton, LMKR and Paradigm Ltd. Design and Supply Chain IHS Design and Supply Chain solutions provide information for customers that allow them to manage a product from conception to research and development to production, maintenance and disposal. It also provides companies access to specifications and standards. The Company�� offerings include market and technology research and analysis; standards management solutions, including more than 370 commercial and military standards and specification publishing organizations; advanced product design and process engineering; strategic product content and supply chain management; environmentally compliant product design; counterfeit part risk mitigation; product performance and cost optimization, and indirect parts and maintenance, repair, and operations logistics, inventory and cash flow optimization tables, including wind, solar, and hydro power. The Company competes with SAI Global and Thomson Reuters Corporation. Defense, Risk and Security IHS delivers open source intelligence in the areas of global defense, risk, and security, including maritime domain awareness. IHS offers open source intelligence solutions for military planners, national security analysts, and defense and maritime industry strategy and planning professionals. The Company�� offerings include military and national security assessments; defense equipment and technology information; defense budgets and procurement forecasting; defense industry trends and analysis; terrorism and insurgency analysis; global commercial ship identification and specifications; live tracking of commercial ship movements; shipping and shipbuilding markets and forecasts, and ports and port security information. The Company competes with McGraw-Hill, Gannett, Forecast International and Control Risks Group. EHS and Sustainability IHS EHS and Sustainability solutions support critical decisions around environmental, health and safety, operational risk, greenhouse gas and energy, product stewardship and corporate responsibility. The Company�� offerings include global and local software implementations; material compliance and lifecycle information content; strategic planning services in greenhouse gas management and cap-and-trade; compliance and verification expertise for local, regional, national, and international EHS and sustainability management system responsibilities, and risk management assessment across a range of industries. The Company competes with SAP and Verisk. Country and Industry Forecasting IHS delivers detailed forecasts and analysis of economic conditions within political, economic, legal, tax, operational, and security environments worldwide. Additionally, IHS provides forecasts, market-sizing, and risk assessments for a number of industries worldwide, including aerospace and defense, agriculture, automotive, chemicals, construction, consumer and retail, energy, finance, government, healthcare and pharmaceutical, military and security, mining and metals, commerce and transport, and telecommunications. Its offerings include in-depth analysis of the business conditions, economic prospects, and risks in more than 200 countries and more than 170 industries; security risk analysis and daily updates on both Foreign Direct Investment (FDI) and sovereign risk ratings in more than 200 countries; event-driven updates of its risk analysis and ratings; short-, medium- and long-term forecasts for business planning and decision making; historical information since 1970; Deep market intelligence for the automotive, agriculture, chemicals, construction, consumer goods, commerce and transport, energy, financial, healthcare and pharmaceutical, telecommunications, and steel industries; and scenario explorations examining alternative outcomes to the questions impacting global business. The Company competes with Economist Intelligence Unit and Moody's Corporation. Commodities, Pricing and Cost IHS offers information, forecasts, and analysis to help its customers understand the how, when, and what of commodity prices and labor costs. IHS analysts monitor and forecast more than 1,300 global price, wage, and manufacturing costs across the regions for sectors, including energy products, chemicals, steel, nonferrous metals, industrial machinery and equipment, electronic components, paper and packaging, transportation, and building materials. Its offerings include analysis and forecasts for more than 1,300 global price, wage, and manufacturing costs; market intelligence of drivers, assumptions, and risks relating to commodity and service prices; cost and price data with actionable insights; forecasts covering global spot market prices, wages, and material costs; advisory forums to assist in monitoring, forecasting, and managing power and energy portfolio project costs, and consulting capabilities that enable clients to source materials. Advisors' Opinion:- [By Rich Smith]
Colorado-based IHS (NYSE: IHS ) will be under new management soon. The business analytics provider announced Wednesday that current President and Chief Operating Officer Scott Key will take over the role of President and Chief Executive Officer from Jerre Stead on June 1.
10 Best Energy Stocks To Invest In 2014: CONSOL Energy Inc (CNX)
CONSOL Energy Inc. (CONSOL Energy), incorporated in 1991, is a producer of coal and natural gas for global energy and raw material markets, which include the electric power generation industry and the steelmaking industry. During the year ended December 31, 2011, the Company produced 62.6 million tons of high-British thermal unit (Btu) bituminous coal from 12 mining complexes in the United States. In addition, it provides energy services, including river and dock services, terminal services, industrial supply services, coal waste disposal services and land resource management services. The Company operates in two segments: Coal and Gas. In July 2012, Cloud Peak Energy Inc. acquired Youngs Creek Mining Company, LLC (Youngs Creek) joint venture and other related coal and surface assets from Chevron U.S.A. Inc. (Chevron) and the Company.
Coal Operations
The principal activities of the Coal unit are mining, preparation and marketing of thermal coal, sold primarily to power generators, and metallurgical coal, sold to metal and coke producers. The Coal division consists of four reportable segments, which includes Thermal, Low Volatile Metallurgical, High Volatile Metallurgical and Other Coal. Each of these reportable segments includes a number of operating segments (mines or type of coal sold). During 2011, the Thermal aggregated segment included the Bailey, Blacksville #2, Enlow Fork, Fola Complex, Loveridge, McElroy, Miller Creek Complex, Robinson Run and Shoemaker mines. During 2011, the Low Volatile Metallurgical coal aggregated segment included the Buchanan mine. During 2011, the High Volatile Metallurgical coal aggregated segment included Bailey, Blacksville #2, Enlow Fork, Fola Complex, Loveridge, Miller Creek Complex and Robinson Run coal sales.
The Other Coal segment includes its purchased coal activities, idled mine activities, as well as various other activities assigned to the coal division but not allocated to each individual mine. During 2011, the Company! �� reserves were located in northern Appalachia (62%), the mid-western United States (17%), central Appalachia (15%), the western United States (4%), and in western Canada (2%). As of December 31, 2011, the Company had an estimated 4.5 billion tons of proven and probable reserves. During 2011, 94% of its production came from underground mines, 6% from surface mines, and 91% of its production came from mines equipped with longwall mining systems. As of December 31, 2011, CONSOL Energy operated 22 towboats, five harbor boats and a fleet of 625 barges that serve customers along the Ohio, Allegheny, Kanawha and Monongahela Rivers. During 2011, over 84% of all the coal it produced was sold under contracts with terms of one year or more.
Gas Operations
The principal activity of the Gas division is to produce pipeline methane gas for sale primarily to gas wholesalers. The Gas Division consists of four reportable segments, which include Coalbed Methane (CBM), Marcellus, Shallow Oil and Gas and Other Gas. The Other Gas segment includes its purchased gas activities, as well as various other activities assigned to the gas division but not allocated to each individual well type. Its gas division focuses on developing the Marcellus acreage position in southwest Pennsylvania, central Pennsylvania and northwest West Virginia. CONSOL Energy�� all Other segment includes terminal services, river and dock services, industrial supply services and other business activities. Its gas operations primarily produce CBM, which is a gas that resides in coal seams. The Company�� Coalbed Methane operations are located in central Appalachia in Southwest Virginia. Its CBM production also comes from northern Appalachia in northwestern West Virginia and southwestern Pennsylvania where it drills vertical-to-horizontal CBM wells.
As of December 31, 2011, the Company had rights to extract CBM in Virginia from approximately 359,000 net CBM acres, which cover a portion of its coal reserves in Cen! tral Appa! lachia. CONSOL Energy produces gas primarily from the Pocahontas #3 seam, which is the coal seam mined by its Buchanan Mine. The Company also has right to extract CBM in northwestern West Virginia and southwestern Pennsylvania from approximately 859,000 net CBM acres, which contains its recoverable coal reserves in Northern Appalachia. CONSOL Energy produces gas primarily from the Pittsburgh #8 coal seam.
In central Pennsylvania, the Company has the right to extract CBM from approximately 263,000 net CBM acres, which contains its recoverable coal reserves, as well as leases from other coal owners. In addition, CONSOL Energy controls 810,000 net CBM acres in Illinois, Kentucky, Indiana and Tennessee. It also has the right to extract CBM on 139,000 net acres in the San Juan Basin, 20,000 net acres in the Powder River Basin and 92,000 net acres in eastern Ohio and central West Virginia. Its Marcellus wells are primarily horizontal wells with 2,500 to 5,000 feet of lateral length. As of December 31, 2011, the Company had the right to extract natural gas in Pennsylvania, West Virginia and New York from approximately 361,000 net acres.
CONSOL Energy controls approximately 346,000 net acres of rights to gas in the New Albany shale in Kentucky, Illinois and Indiana. The New Albany shale is a formation containing gaseous hydrocarbons, and its acreage position has thickness of 50-300 feet at an average depth of 2,500-4,000 feet. CONSOL Energy has 249,000 net acres of Chattanooga Shale. It has 457,000 net acres of Huron shale in Kentucky and Virginia. During 2011, the Company drilled 254.9 net development wells and 47 net developmental wells.
Other Operations
CONSOL Energy provides other services to its own operations and others. These include land services, industrial supply services, terminal services, including break bulk, general cargo and warehouse services, and river and dock services water services. Fairmont Supply Company, which is CONSOL Energy�� subs! idiary, i! s a general-line distributor of mining, drilling, and industrial supplies in the United States. During 2011, approximately 12.6 million tons of coal was shipped through CNX Marine Terminal Inc.�� exporting terminal in the Port of Baltimore. CONSOL Energy�� river operations, located in Monessen, Pennsylvania, transport coal from its mines, coal from other mines and non-coal commodities from river loadout facilities located primarily along the Monongahela and Ohio Rivers in northern West Virginia and southwestern Pennsylvania.
As of December 31, 2011, it operated 22 towboats, five harbor boats and 625 barges. In 2011, its river vessels transported a total of 19.1 million tons of coal and other commodities, including 6.2 million tons of coal produced by CONSOL Energy mines. CONSOL Energy provides dock services for its mines, as well as for third parties at its Alicia Dock, located on the Monongahela River in Fayette County, Pennsylvania. Its subsidiary CNX Water Assets LLC acquires and develops existing sources of water used to support its coal and gas operations.
Advisors' Opinion:- [By Sara Murphy]
Shareholders who aren't divesting are getting active. In this year's proxy season, Alpha Natural Resources (NYSE: ANR ) and CONSOL Energy (NYSE: CNX ) were forced to include shareholder resolutions on their ballots related to fossil fuel reserve valuation risks.
- [By Dan Caplinger]
Conditions in the coal market continue to be tough, but many companies are adapting to the difficult situation in the industry. Peabody Energy (NYSE: BTU ) has benefited from its low-cost coal supplies and has taken advantage of lucrative export markets, where natural gas prices are far less competitive and coal much more popular. Peers Arch Coal (NYSE: ACI ) and CONSOL Energy (NYSE: CNX ) have done their best to follow Peabody's lead into the export markets, with Arch signing a deal to give it greater export capacity and CONSOL owning its own terminal in Baltimore. By contrast, James River hasn't really pursued exports as an option, leaving it much more exposed to harsher regulation and plentiful natural gas supplies.
10 Best Energy Stocks To Invest In 2014: Flotek Industries Inc (FTK)
Flotek Industries, Inc. (Flotek), incorporated on May 17, 1985, is a diversified global supplier of drilling and production related products and services. Its core focus is oilfield specialty chemicals and logistics, down-hole drilling tools and down-hole production tools used in the energy and mining industries. Flotek operates in three segments: Chemicals and Logistics, Drilling Products and Artificial Lift. The Company operates using third party agents in Canada, Mexico, Central America, South America, the Middle East, and Asia. In May 2013, Flotek Industries Inc through its wholly owned subsidiary acquired the entire share capital of Florida Chemical Co Inc.
Chemicals and Logistics
The chemical business provides oil and natural gas field specialty chemicals for use in drilling, cementing, stimulation and production activities. The Company�� specialty chemicals are manufactured to withstand a range of down-hole pressures, temperatures and other well-specific conditions. Flotek operates two laboratories, a technical services laboratory and a research and development laboratory, which focus on design, development and testing of new chemical formulations and enhancement of existing products, often in cooperation with the customers. Its micro-emulsions are stable mixtures of oil, water and surface active agents, forming complex nano-fluids, in which the molecules are organized into nanostructures. The micro-emulsions are composed of renewable plant derived cleaning ingredients and oils and are biodegradable. Flotek�� logistics business designs, project manages and operates automated bulk material handling and loading facilities. These bulk facilities handle oilfield products, including sand and other materials for well-fracturing operations, dry cement and additives for oil and gas well cementing, and supply materials used in oilfield operations.
Drilling Products
Flotek is a provider of down-hole drilling tools used in the oilfield, min! ing, water-well and industrial drilling activities. It manufactures, sells, rents and inspects specialized equipment for use in drilling, completion, and production and workover activities. The rental tools include stabilizers, drill collars, reamers, wipers, jars, shock subs, wireless survey, and measurement while drilling (MWD) tools and mud-motors. Equipment sold primarily includes mining equipment, centralizers and drill bits. Flotek focuses its product marketing primarily in the Southeast, Northeast, Mid-Continent and Rocky Mountain regions of the United States, with international sales conducted through third party agents.
Artificial Lift
Flotek provides pumping system components, electric submersible pumps (ESPs), gas separators, production valves and services. The products address the needs of coal bed methane and traditional oil and gas production to move gas, oil and other fluids from the producing horizon to the surface. The Artificial Lift products employ technologies to improved performance. The Petrovalve product optimizes pumping efficiency in horizontal completions, heavy oil and wells with high liquid to gas ratios. Artificial Lift products are manufactured in China, assembled domestically and distributed globally.
Advisors' Opinion:- [By David Smith]
Flotek Industries (NYSE: FTK )
I've mentioned Flotek Industries to Fools in the past. The relatively small ($940 million capitalization and growing) company provides a range of products and assistance for oil and gas operations, from well construction to production. It's also the only services company -- and one of but a handful of companies in any sector -- that's been accorded a perfect consensus of one (strong buy) by the analysts.
10 Best Energy Stocks To Invest In 2014: Magellan Midstream Partners L.P.(MMP)
Magellan Midstream Partners, L.P., together with its subsidiaries, engages in the transportation, storage, and distribution of refined petroleum products and crude oil in the United States. Its pipeline system transports petroleum products and liquefied petroleum gases from the Gulf Coast refining region of Texas through the Midwest to Colorado, North Dakota, Minnesota, Wisconsin, and Illinois. The company owns and operates marine terminals, which store and distribute refined petroleum products, blendstocks, crude oils, heavy oils, and feedstocks, as well as inland terminals that consist of storage tanks connected to third-party interstate pipeline systems to deliver refined petroleum products. Its ammonia pipeline system transports ammonia from production facilities in Texas and Oklahoma to terminals in the Midwest. The company also stores, blends, and distributes biofuels, such as ethanol and biodiesel. As of March 31, 2011, it operated approximately 9, 600 miles of petr oleum products pipeline system and 51 terminals; 6 marine petroleum terminals located along the United States Gulf and East Coasts; a crude oil storage in Cushing, Oklahoma; 27 petroleum products inland terminals located principally in the southeastern United States; and a 1,100-mile ammonia pipeline system and 6 associated terminals. The company also provides ancillary services, such as heating, blending, and mixing of stored petroleum products and additive injection services. Its customers comprise independent and integrated oil companies, wholesalers, retailers, railroads, airlines, and regional farm co-operatives. The company serves various markets, including retail gasoline stations, truck stops, farm co-operatives, railroad fueling depots, and military and commercial jet fuel users. Magellan GP, LLC serves as the general partner of the company. The company was founded in 2000 and is based in Tulsa, Oklahoma.
Advisors' Opinion:- [By Dividends4Life]
Magellan Midstream Partners LP (MMP) is engaged in the transportation, storage and distribution of refined petroleum products primarily through its 9,600-mile pipeline system.
Yield: 3.9% | Years of Dividend Growth: 12
10 Best Energy Stocks To Invest In 2014: Solar Power Inc (SOPW)
Solar Power, Inc., incorporated on May 22, 2006, is a global solar energy facility (SEF) developer offering SEF development services. The Company offers an approach to design, engineer and construct photovoltaic (PV) solar systems for commercial and utility applications. In addition to developing SEFs using products manufactured by LDK Solar Co., Ltd. (LDK), its parent company, the Company also sells solar modules and balance of system components manufactured by third party vendors to other integrators in the United States, Asian, and European markets. In June 2012, the Company acquired 100% interest in Italy-based Solar Green Technologies (SGT) from LDK Solar Europe Holdings S.A., a wholly owned subsidiary of LDK Solar Co., Ltd.
In addition to designing, engineering and constructing SEFs, the Company also provides long-term operations and maintenance (O&M) services through its O&M program SPIGuardianTM. This service program provides a suite of services that commence upon a facility�� commissioning to provide performance monitoring, system reporting, preventative maintenance and full warranty support over the anticipated life of the SEF.
The Company competes with Sun Power Corporation, First Solar, SPG Solar, Sun Edison, Kyocera Corporation, Mitsubishi, Solar World AG, Sharp Corporation, Yiugli, Solar Fun and Suntech and Canadian Solar.
10 Best Energy Stocks To Invest In 2014: China Petroleum & Chemical Corporation(SNP)
China Petroleum & Chemical Corporation engages in the exploration, development, production, and marketing of crude oil and natural gas properties primarily in China. It operates 16 oil and gas production fields in China. As of December 31, 2010, the company?s estimated proved reserves of crude oil and natural gas consisted of 3,963 million barrels-of-oil equivalent comprising 2,888 million barrels of crude oil and 6,447 billion cubic feet of natural gas. It also engages in the refining of crude oil; marketing and distribution of refined petroleum products; and production and sale of petrochemical products that consist of intermediate petrochemicals, synthetic resins, synthetic fiber monomers and polymers, synthetic fibers, synthetic rubber, and chemical fertilizers, as well as owns and operates oil depots and service stations. The company was founded in 2000 and is based in Beijing, the People?s Republic of China. China Petroleum & Chemical Corporation is a subsidiary of China Petrochemical Corporation.
Advisors' Opinion:- [By Dan Carroll]
China's nascent energy sector's also hurting between manufacturing's fall and weak exports. Chinese diesel exports declined�to their weakest in seven months in May, and China's Xinhua News Agency sees Chinese domestic diesel demand falling further in the current quarter to match falling�prices. That's not good news for Sinopec (NYSE: SNP ) , one of the world's largest companies and China's leading oil giant. While Sinopec's about as safe a stock as you can imagine in China -- it's the fifth-largest�oil company in the world and has engaged in multiple deals with foreign oil giants in exploration and other activities -- the firm's shares could take a hit if domestic demand and prices continue to slump.
Subscribe to:
Posts (Atom)