BALTIMORE (Stockpickr) -- A modest correction for the last three trading sessions is shaking the weak hands out of stocks this week. Ultimately, that's a good thing for the health of this rally, even if it means that the S&P 500 has a lot further to correct in June.
>>5 Huge Stocks to Trade for Huge Gains
And it does.
Since November 2012, the S&P 500 index has traded in a very tight uptrend, bouncing between a pair of well-defined trend lines all the way up. That hasn't changed in 2014, despite the definite changeover from the nonstop rally that investors enjoyed last year. But with the S&P sitting toward the top of its channel now, the big index could conceivably correct another 4% from here without even threatening the uptrend that's propelled stocks 40% in the last 19 months.
Remember, though, the indices are "market averages." That means that when the market corrects, some names are set to correct a lot harder than others. A 4% correction in the S&P could translate into a 30% correction in an individual weakening issue. Those are the names to avoid in June -- and a handful of big names look downright toxic this summer.
>>5 Stocks Insiders Love Right Now
Just to be clear, the companies I'm talking about today aren't exactly junk. By that, I mean they're not next up in line at bankruptcy court. But that's frankly irrelevant; from a technical analysis standpoint, sellers are shoving around these toxic stocks right now. For that reason, fundamental investors need to decide how long they're willing to take the pain if they want to hold onto these firms in the weeks and months ahead. And for investors looking to buy one of these positions, it makes sense to wait for more favorable technical conditions (and a lower share price) before piling in.
For the unfamiliar, technical analysis is a way for investors to quantify qualitative factors, such as investor psychology, based on a stock's price action and trends. Once the domain of cloistered trading teams on Wall Street, technicals can help top traders make consistently profitable trades and can aid fundamental investors in better planning their stock execution.
>>3 Huge Stocks Everyone Is Talking About
So without further ado, let's take a look at five "toxic stocks" you should be unloading.
Aegon
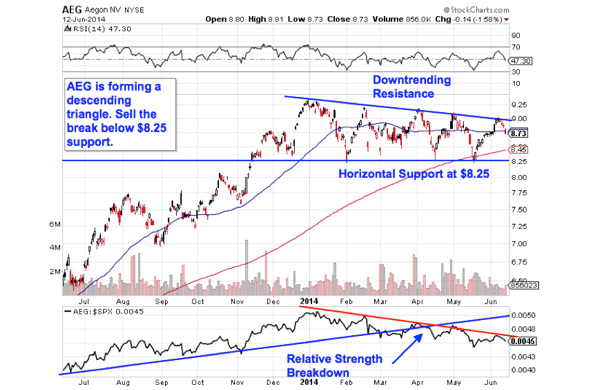
Up first is Aegon (AEG), the $18 billion Netherlands-based financial services stock. AEG has posted strong performance in the last year, climbing nearly 27% higher since the summer of 2013. But shares haven't done much at all in 2014, and that sideways churn is leading up to big downside potential in shares this week.
>>5 Hated Earnings Stocks You Should Love
Aegon is currently forming a descending triangle pattern, a bearish setup that's formed by a horizontal support level below shares (at $8.25 in this case) and downtrending resistance above shares. Basically, as AEG bounces in between those two technically important price levels, it's getting squeezed closer to a breakdown below that $8.25 price floor. When that happens, we've got our sell signal. AEG's setup isn't "textbook" -- the pattern is coming in at the top of this stock's recent range, rather than the bottom -- but the trading implications are just the same if $8.25 gets violated.
We're seeing that confirmed by relative strength right now. AEG's relative strength uptrend broke in early April, a signal that shares are statistically more apt to underperform the S&P 500 for the next three-to-ten month span. Buyers beware.
America Movil
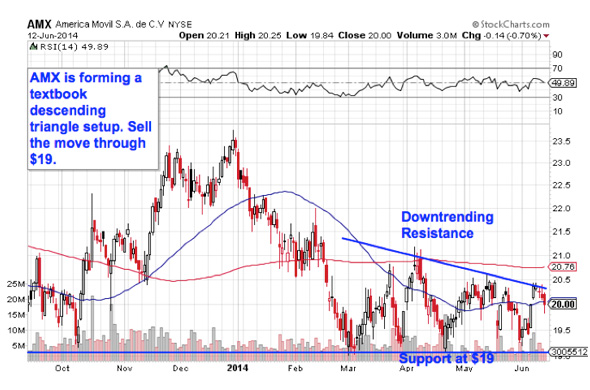
Mexican telecom company America Movil (AMX) is another descending triangle setup to watch this week, albeit a more textbook one. $19 is the breakdown level to watch in shares of AMX right now. A breakdown below $19 is the signal that more downside looks likely, and it's time to join the sellers.
>>4 Stocks Breaking Out on Big Volume
Why the significance at $19? Whenever you're looking at any technical price pattern, it's critical to keep buyers and sellers in mind. Patterns like the descending triangle are a good way to quickly describe what's going on in a stock, but they're not the reason it's tradable. Instead, it all comes down to supply and demand for shares.
That horizontal $19 level in America Movil is the spot where there's previously been an excess of demand for shares; in other words, it's a price where buyers have been more eager to step in and buy shares at a lower price than sellers were to sell. That's what makes a breakdown below support so significant -- the move means that sellers are finally strong enough to absorb all of the excess demand at the at price level. Keep a close eye on $19 this week.
Raytheon
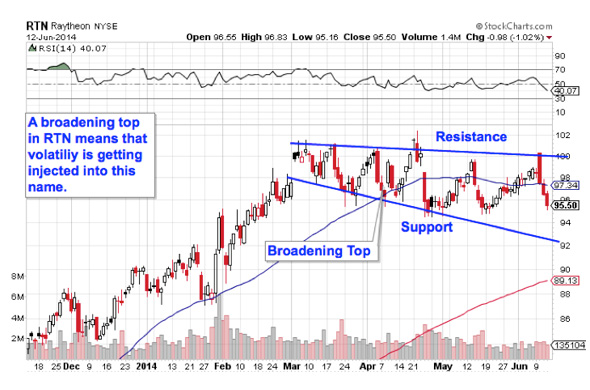
Defense contractor Raytheon (RTN) has more or less kept pace with the broad market in 2014, up 5.3% since the calendar flipped to January. But that doesn't mean that RTN is a good way to get exposure to the S&P's moves for the rest of the year. Those gains look ready to erode as we head into the summer.
>>4 Big Stocks on Traders' Radars
Raytheon is currently forming a broadening top pattern, a technical setup that looks exactly like it sounds. The setup formed by a pair of support and resistance levels that are diverging after a big move higher. The real problem of a broadening top is the fact that it indicates volatility is getting injected into shares, particularly to the downside. Like the other names on our "toxic list," the broadening top is a breakdown trade. A move through support (currently at $92) is the sell signal.
The problem, though, is that support is downtrending in RTN's broadening top. That means that shares can move substantially lower without actually ever breaking down through that downsloping support level. For that reason, it makes sense to sell RTN here rather than wait. If you're looking for a shorting opportunity, I'd recommend keeping a protective stop right above resistance at $100.
Alliance Data Systems
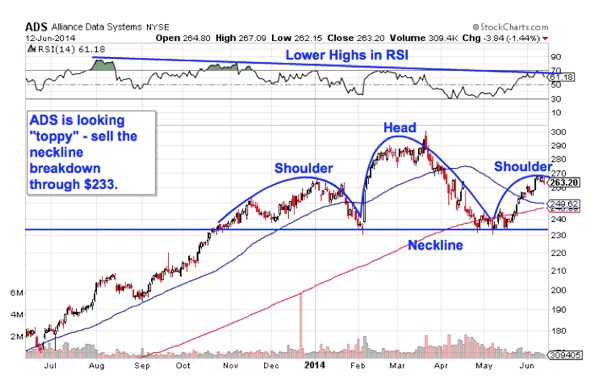
After moving 47% higher in the last 12 months, shares of Alliance Data Systems (ADS) are starting to look "toppy." Here's how to trade it:
ADS is currently forming a head and shoulders top, a setup that indicates exhaustion among buyers. The setup is formed by two swing highs that top out at approximately the same level (the shoulders), separated by a higher high (the head). The sell signal comes on a move through ADS' neckline, which is currently right at $233. If shares violate that neckline level, look for $170 as the next-nearest support level where shares could catch a bid again.
Momentum, measured by 14-day RSI, provides some foreshadowing for the downside in ADS. While this stock's price has been slowly moving higher (or worst-case, flat) over the last ten months, momentum has been making lower highs and bleeding off. That's a big red flag.
Las Vegas Sands
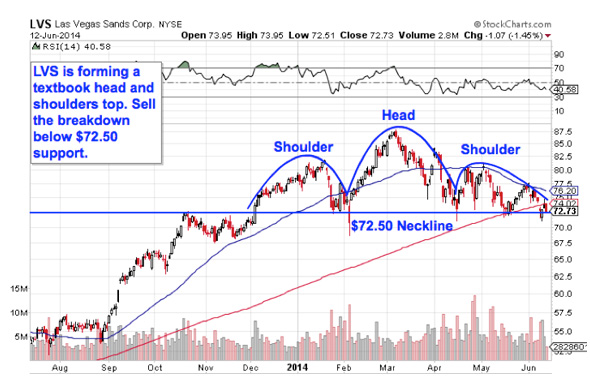
Last up is Las Vegas Sands (LVS), a name that's showing off the exact same classic head and shoulders top pattern as the one in ADS. For LVS, the neckline level to watch is $72.50, a line in the sand that's been getting tested in a big way this week. If LVS fails to hold support at $72.50, there's a lot of downside risk in this stock.
Lest you think that the head and shoulders is too well-known to be worth trading, the research suggests otherwise. A recent academic study conducted by the Federal Reserve Board of New York found that the results of 10,000 computer-simulated head-and-shoulders trades resulted in "profits [that] would have been both statistically and economically significant."
That's good reason to keep an eye on both ADS and LVS this week.
To see this week's trades in action, check out the Toxic Stocks portfolio on Stockpickr.
-- Written by Jonas Elmerraji in Baltimore.
RELATED LINKS:
>>5 Stocks Under $10 Set to Soar
>>3 Stocks Rising on Unusual Volume
>>Apple's Lower Price Tags Means Bigger Gains in 2014
Follow Stockpickr on Twitter and become a fan on Facebook.
At the time of publication, author had no positions in stocks mentioned.
Jonas Elmerraji, CMT, is a senior market analyst at Agora Financial in Baltimore and a contributor to
TheStreet. Before that, he managed a portfolio of stocks for an investment advisory returned 15% in 2008. He has been featured in Forbes , Investor's Business Daily, and on CNBC.com. Jonas holds a degree in financial economics from UMBC and the Chartered Market Technician designation.Follow Jonas on Twitter @JonasElmerraji
No comments:
Post a Comment