BALTIMORE (Stockpickr) -- Don't get distracted by cheers on Wall Street this week. While most investors are busy celebrating another set of all-time highs in the stock market, a handful of "toxic" stocks could be ravaging your portfolio returns.
Make no mistake -- I'm not warning you about an impending crash today. This column isn't my version of a cardboard sign that reads, "The end is near". In fact, I've made no bones about the fact that I've been bullish all year.
But there's a big difference between thinking that the broad market is going to move higher, and thinking that every single stock is going to go higher. It's the laggard names that will gut your performance if you aren't quick to unload them.
That's why we're taking a closer look at five "toxic stocks" you should be selling in November. To be fair, the companies I'm talking about today aren't exactly "junk."
By that, I mean they're not next up in line at bankruptcy court -- but that's frankly irrelevant. From a technical analysis standpoint, they're some of the worst-positioned names out there right now. For that reason, fundamental investors need to decide how long they're willing to take the pain if they want to hold onto these firms this summer. And for investors looking to buy one of these positions, it makes sense to wait for more favorable technical conditions (and a lower share price) before piling in.
For the unfamiliar, technical analysis is a way for investors to quantify qualitative factors, such as investor psychology, based on a stock's price action and trends. Once the domain of cloistered trading teams on Wall Street, technicals can help top traders make consistently profitable trades and can aid fundamental investors in better planning their stock execution.
So, without further ado, let's take a look at five "toxic stocks" you should be unloading.
Luxottica Group
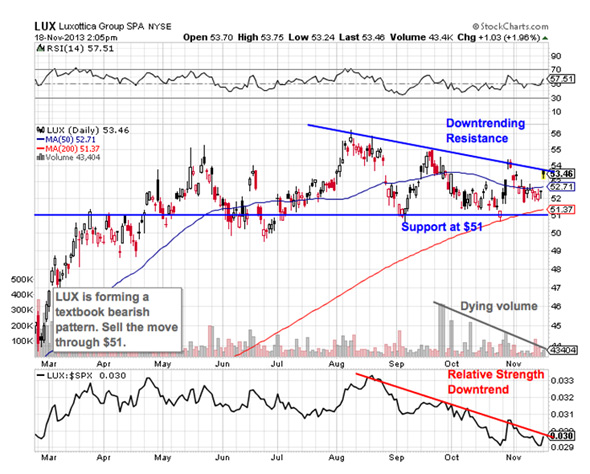
First up is $25 billion eyewear stock Luxottica Group (LUX). Luxottica has posted some solid performance year-to-date, rallying more than 28% since the calendar flipped over to January. But this stock looks downright toxic right now. Here's why.
Luxottica is currently forming a bearish price setup called a descending triangle. The pattern is formed by a horizontal support level below shares at $51 and downtrending resistance to the topside. As shares bounce between those two technically significant price levels, LUX is getting squeezed closer to a breakdown below that $51 price floor. When that happens, we've got our sell signal in this fashion stock.
Declining volume over the course of the setup in LUX adds some confirmation to the trade, but the downtrend in relative strength is the real problem in this chart. LUX has been underperforming the broad market horrifically in the last quarter, and a move through the $51 level would sap a lot more buying pressure from shares.
If you still own LUX, look for that sell signal as your exit.
iRobot

Small-cap robotics maker iRobot (IRBT) is an interesting company with a very cool line-up of products -- that's part of what's spurred a huge 81% rally in 2013. But none of that changes the fact that shares look toxic this quarter. In fact, the valuation premium on IRBT means that it could take a bigger haircut before it finds a floor.
iRobot is currently forming the exact same setup as the one we're seeing in LUX: a descending triangle. For IRBT, support comes in at $32. If shares slip below that price, then it's time to unload shares.
Whenever you're looking at any technical price pattern, it's critical to think in terms of buyers and sellers. Triangles and other pattern names are a good quick way to explain what's going on in a stock, but they're not the reason it's tradable. Instead, it all comes down to supply and demand for shares.
That support level at $32 is a price where there had been an excess of demand of shares; in other words, it's a place where buyers were more eager to step in and buy shares at a lower price than sellers were to sell. That's what makes a breakdown below $32 so significant -- the move would indicate that sellers are finally strong enough to absorb all of the excess demand above that price level. Wait for that trigger before you sell.
HCP
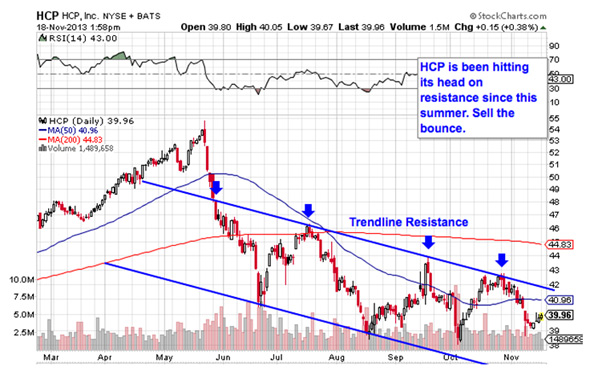
You don't have to be an expert technical analyst to see what's going on in shares of health care REIT HCP (HCP). This stock is in stuck in a textbook downtrending channel. Fundamentally, there's a lot to like about this stock, but HCP is a good example of why it's never a good idea to chase yield; HCP may have a 5.29% annual dividend payout, but shares have lost more than that in the last month alone.
HCP's price channel has provided traders with a high-probability range for shares since the middle of the year. Despite the last four attempts at pushing through trendline resistance, shares have been swatted down on each attempt. And while HCP has been turning higher in the last few sessions, investors should look at trendline resistance at $42 with a lot of skepticism. That's probably the worst possible time to be a buyer.
Instead, it makes sense to sell near the trendline for a most efficient exit in HCP. Yes, trendlines do eventually break, but getting in now is a big mistake. After all "this time it's different" are probably the most expensive four words in the English language. As long as shares stay within that channel, sell the bounce.
Silicon Image
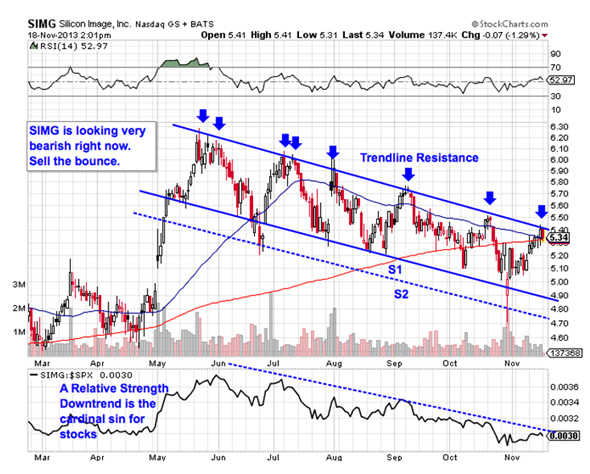
The exact same setup is shaping up in shares of small-cap semiconductor firm Silicon Image (SIMG). Like HCP, this firm is stuck trading in a downtrending channel. Unlike HCP, trendline resistance is a whole lot stronger in this stock. Shares have gotten swatted down on each of the last eight attempts through that ceiling; with shares at resistance again, the high-probability move is to the downside.
Again, relative strength has been terrible since the summer; SIMG is underperforming the S&P by a considerable margin. Downtrending relative strength is a cardinal sin for stocks, so with shares sitting at resistance, now's a stellar place to be a seller. While support has been pretty strong along the way down, SIMG's previous penetrations through S1 should be a big red flag that buyers are skittish.
SIMG is in a textbook downtrend right now. Don't get caught on the wrong side of the trade.
LKQ
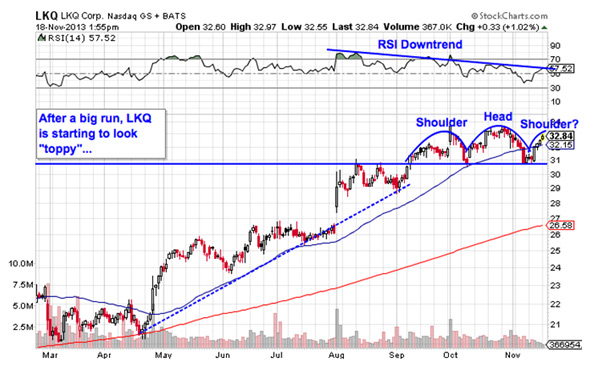
Last up on our list of toxic names is LKQ (LKQ), a $10 billion auto parts stock. Even though it's been a strong year for auto names, LKQ is starting to look "toppy" thanks to a prominent reversal pattern that's been shaping up in shares. While it's still early to suggest selling (or shorting) LKQ, shareholders should start thinking defensively here.
LKQ is currently forming a head and shoulders top, a bearish reversal setup that indicates exhaustion among buyers. The setup is formed by two swing highs that top out around the same level (the shoulders), separated by a bigger peak called the head; the sell signal comes on the breakdown below the pattern's "neckline" level, which is right at $31 at the moment for LKQ. If this stock can't catch a bid at $31, unload it.
Lower highs in momentum add some extra confidence to the bear bias in LKQ this fall. Despite the pop shares have seen in the last few days, 14-day RSI can't break its downtrend. Hopeful bulls take note: this pattern gets invalidated on a move above the head at $33.
To see this week's trades in action, check out the Technical Setups for the Week portfolio on Stockpickr.
-- Written by Jonas Elmerraji in Baltimore.
No comments:
Post a Comment